What is happening in the Atlantic Ocean to the AMOC?
8 min read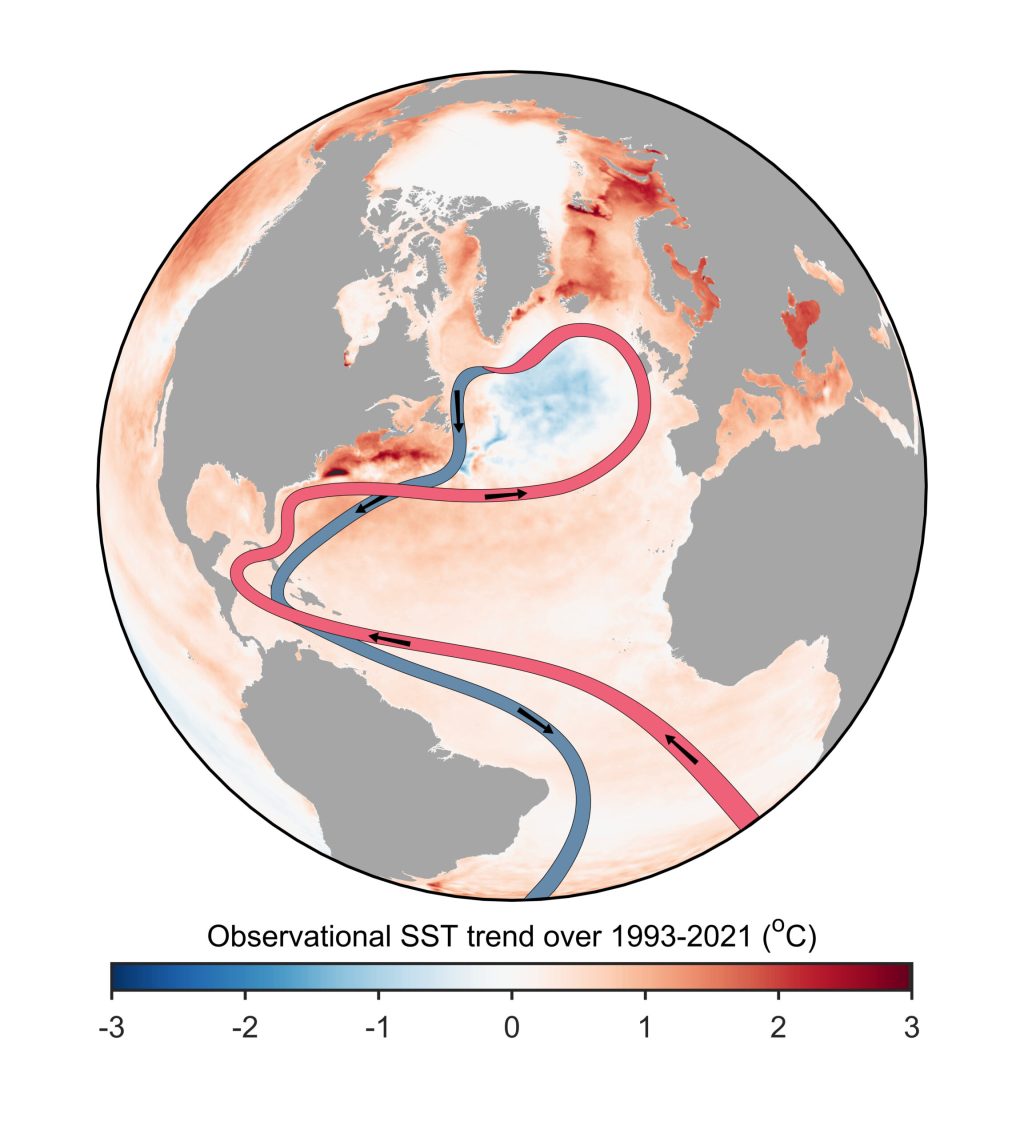
For various reasons I’m motivated to provide an update on my current thinking regarding the slowdown and tipping point of the Atlantic Meridional Overturning Circulation (AMOC). I attended a two-day AMOC session at the IUGG Conference the week before last, there’s been interesting new papers, and in the light of that I have been changing my views somewhat. Here’s ten points, starting from the very basics, so you can easily jump to the aspects that interest you.
1. The AMOC is a big deal for climate. The Atlantic meridional overturning circulation (AMOC) is a large-scale overturning motion of the entire Atlantic, from the Southern Ocean to the high north. It moves around 15 million cubic meters of water per second (i.e. 15 Sverdrup). The AMOC water passes through the Gulf Stream along a part of its much longer journey, but contributes only the smaller part of its total flow of around 90 Sverdrup. The AMOC is driven by density differences and is a deep reaching vertical overturning of the Atlantic; the Gulf Stream is a near-surface current near the US Atlantic coast and mostly driven by winds. The AMOC however moves the bulk of the heat into the northern Atlantic so is highly relevant for climate, because the southward return flow is very cold and deep (heat transport is the flow multiplied by the temperature difference between northward and southward flow). The wind-driven part of the Gulf Stream contributes much less to the net northward heat transport, because that water returns to the south at the surface in the eastern Atlantic at a temperature not much colder than the northward flow, so it leaves little heat behind in the north. So for climate impact, the AMOC is the big deal, not the Gulf Stream.
2. The AMOC has repeatedly shown major instabilities in recent Earth history, for example during the Last Ice Age, prompting concerns about its stability under future global warming, see e.g. Broecker 1987 who warned about “unpleasant surprises in the greenhouse”. Major abrupt past climate changes are linked to AMOC instabilities, including Dansgaard-Oeschger-Events and Heinrich Events. For more on this see my Review Paper in Nature.
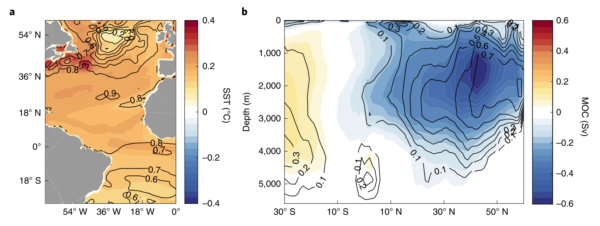
3. The AMOC has weakened over the past hundred years. We don’t have direct measurements over such a long time (only since 2004 from the RAPID project), but various indirect indications. We have used the time evolution of the ‘cold blob’ shown above, using SST observations since 1870, to reconstruct the AMOC in Caesar et al. 2018. In that article we also discuss a ‘fingerprint’ of an AMOC slowdown which also includes excessive warming along the North American coast, also seen in Figure 1. That this fingerprint is correlated with the AMOC in historic runs with CMIP6 models has recently been shown by Latif et al. 2022, see Figure 2.
Others have used changes in the Florida Current since 1909, or changes in South Atlantic salinity, to reconstruct past AMOC changes – for details check out my last AMOC article here at RealClimate.
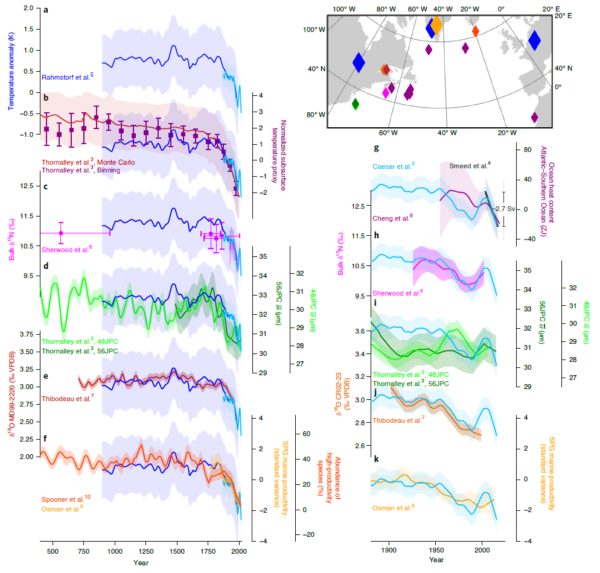
4. The AMOC is now weaker than any time in the past millennium. Several groups of paleoclimatologists have used a variety of methods to reconstruct the AMOC over longer time spans. We compiled the AMOC reconstructions we could find in Caesar et al. 2021, see Figure 3. In case you’re wondering how the proxy data reconstructions compare with other methods for the recent variability since 1950, that is shown in Caesar et al. 2022 (my take: quite well).
5. The long-term weakening trend is anthropogenic. For one, it is basically what climate models predict as a response to global warming, though I’d argue they underestimate it (see point 8 below). A recent study by Qasmi 2023 has combined observations and models to isolate the role of different drivers and concludes for the ‘cold blob’ region: “Consistent with the observations, an anthropogenic cooling is diagnosed by the method over the last decades (1951–2021) compared to the preindustrial period.”
In addition there appear to be decadal oscillations particularly after the mid-20th Century. They may be natural variability, or an oscillatory response to modern warming, given there is a delayed negative feedback in the system (weak AMOC makes the ‘cold blob’ region cool down, that increases the water density there, which strengthens the AMOC). Increasing oscillation amplitude may also be an early warning sign of the AMOC losing stability, see point 10 below.
The very short term SST variability (seasonal, interannual) in the cold blob region is likely just dominated by the weather, i.e. surface heating and cooling, and not indicative of changes in ocean currents.
6. The AMOC has a tipping point, but it is highly uncertain where it is. This tipping point was first described by Stommel 1961 in a highly simple model which captures a fundamental feedback. The region in the northern Atlantic where the AMOC waters sink down is rather salty, because the AMOC brings salty water from the subtropics to this region. If it becomes less salty by an inflow of freshwater (rain or meltwater from melting ice), the water becomes less dense (less “heavy”), sinks down less, the AMOC slows down. Thus it brings less salt to the region, which slows the AMOC further. It is called the salt advection feedback. Beyond a critical threshold this becomes a self-amplifying “vicious circle” and the AMOC grinds to a halt. That threshold is the AMOC tipping point. Stommel wrote: “The system is inherently frought with possibilities for speculation about climatic change.”
That this tipping point exists has been confirmed in numerous models since Stommel’s 1961 paper, including sophisticated 3-dimensional ocean circulation models as well as fully fledged coupled climate models. We published an early model comparison about this in 2005. The big uncertainty, however, is in how far the present climate is from this tipping point. Models greatly differ in this regard, the location appears to be sensitively dependent on the finer details of the density distribution of the Atlantic waters. I have compared the situation to sailing with a ship into uncharted waters, where you know there are dangerous rocks hidden below the surface that could seriously damage your ship, but you don’t know where they are.
7. Standard climate models have suggested the risk is relatively small during this century. Take the IPCC reports: For example, the Special Report on the Ocean and Cryosphere concluded:
The AMOC is projected to weaken in the 21st century under all RCPs (very likely), although a collapse is very unlikely (medium confidence). Based on CMIP5 projections, by 2300, an AMOC collapse is about
as likely as not for high emissions scenarios and very unlikely for lower ones (medium confidence).
It has long been my opinion that “very unlikely”, meaning less than 10% in the calibrated IPCC uncertainty jargon, is not at all reassuring for a risk we really should rule out with 99.9 % probability, given the devastating consequences should a collapse occur.
8. But: Standard climate models probably underestimate the risk. There are two reasons for that. They largely ignore Greenland ice loss and the resulting freshwater input to the northern Atlantic which contributes to weakening the AMOC. And their AMOC is likely too stable. There is a diagnostic for AMOC stability, namely the overturning freshwater transport, which I introduced in a paper in 1996 based on Stommel’s 1961 model. Basically, if the AMOC exports freshwater out of the Atlantic, then an AMOC weakening would lead to a fresher (less salty) Atlantic, which would weaken the AMOC further. Data suggest that the real AMOC exports freshwater, in most models it imports freshwater. This is still the case and was also discussed at the IUGG conference.
Here a quote from Liu et al. 2014, which nicely sums up the problem and gives some references:
Using oceanic freshwater transport associated with the overturning circulation as an indicator of the AMOC bistability (Rahmstorf 1996), analyses of present-day observations also indicate a bistable AMOC (Weijer et al. 1999; Huisman et al. 2010; Hawkins et al. 2011a,b; Bryden et al. 2011; Garzoli et al. 2012). These observational studies suggest a potentially bistable AMOC in the real world. In contrast, sensitivity experiments in CGCMs tend to show a monostable AMOC (Stouffer et al. 2006), indicating a model bias toward a monostable AMOC. This monostable bias of the AMOC in CGCMs, as first pointed out by Weber et al. (2007) and later confirmed by Drijfhout et al. (2011), could be related to a bias in the northward freshwater transport in the South Atlantic by the meridional overturning circulation.
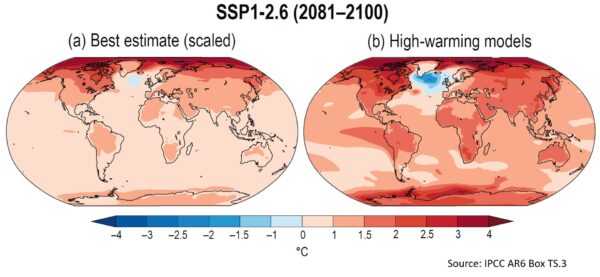
9. Standard climate models get the observed ‘cold blob’, but only later. Here is some graphs from the current IPCC report, AR6.

10. There are possible Early Warning Signals (EWS). New methods from nonlinear dynamics search for those warning signals when approaching tipping points in observational data, from cosmology to quantum systems. They use the critical slowing down, increasing variance or increasing autocorrelation in the variability of the system. There is the paper by my PIK colleague Niklas Boers (2021), which used 8 different data series (Figure 6) and concluded there is “strong evidence that the AMOC is indeed approaching a critical, bifurcation-induced transition.”

Another study, this time using 312 paleoclimatic proxy data series going back a millennium, is Michel et al. 2022. They argue to have found a “robust estimate, as it is based on sufficiently long observations, that the Atlantic Multidecadal Variability may now be approaching a tipping point after which the Atlantic current system might undergo a critical transition.”
And today (update!) a third comparable study by Danish colleagues has been published, Ditlevsen & Ditlevsen 2023, which expects the tipping point already around 2050, with a 95% uncertainty range for the years 2025-2095. Individual studies always have weaknesses and limitations, but when several studies with different data and methods point to a tipping point that is already quite close, I think this risk should be taken very seriously.
Conclusion
Timing of the critical AMOC transition is still highly uncertain, but increasingly the evidence points to the risk being far greater than 10 % during this century – even rather worrying for the next few decades. The conservative IPCC estimate, based on climate models which are too stable and don’t get the full freshwater forcing, is in my view outdated now. I side with the recent Climate Tipping Points report by the OECD, which advised:
Yet, the current scientific evidence unequivocally supports unprecedented, urgent and ambitious climate action to tackle the risks of climate system tipping points.
If you like to know more about this topic, you can either watch my short talk from the Exeter Tipping Points conference last autumn (where also Peter Ditlevsen first presented the study which was just published), or the longer video of my EPA Climate Lecture in Dublin Mansion House last April.


