The Nenana Ice Classic and climate
3 min read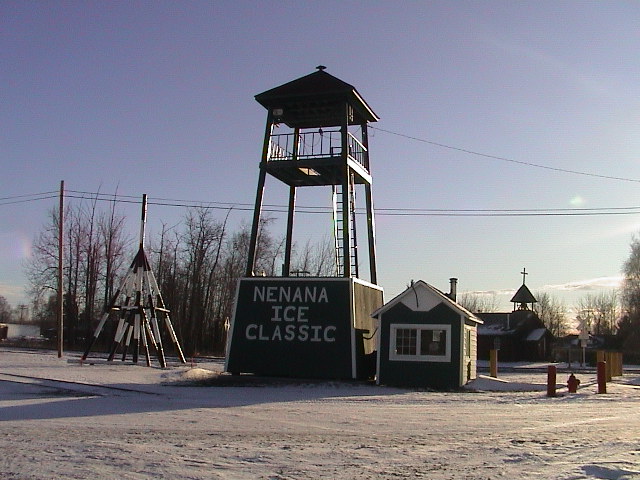
RealClimate –
I am always interested in non-traditional data sets that can shed some light on climate changes. Ones that I’ve discussed previously are the frequency of closing of the Thames Barrier and the number of vineyards in England. With the exceptional warmth in Alaska last month (which of course was coupled with colder temperatures elsewhere), I was reminded of another one, the Nenana Ice Classic.
For those that don’t know what the ‘Classic’ is, it is lottery competition that has been running since 1917 to guess the date on which the Nenana river ice breaks up in the spring. The Nenana river is outside of Fairbanks, Alaska and can be relied on to freeze over every year. The locals put up a tripod on the ice, and when the ice breaks up in the spring, the tripod gets swept away. The closest estimate to the exact time this happens wins the lottery, which can have a quite substantial pot.
Due to the cold spring in Alaska last year, the ice break up date was the latest since 1917, consistent with the spring temperature anomaly state-wide being one of the coldest on record (unsurprisingly the Nenana break up date is quite closely correlated to spring Alaskan temperatures). This year is shaping up to be quite warm (though current temperatures in Nenana (as of March 7) are still quite brisk!).
Since there is now an almost century-long record of these break up dates, it makes sense to look at them as potential indicators of climate change (and interannual variability). The paper by Sagarin and Micheli (2001) was perhaps the first such study, and it has been alluded to many times since (for instance, in the Wall Street Journal and Physics Today in 2008).
The figure below shows the break up date in terms of days after a nominal March 21, or more precisely time from the vernal equinox (the small correction is so that the data don’t get confused by non-climatic calendar issues). The long term linear trend (which is negative and has a slope of roughly 6 days per century) indicates that on average the break up dates have been coming earlier in the season. This is clear despite a lot of year-to-year variability:
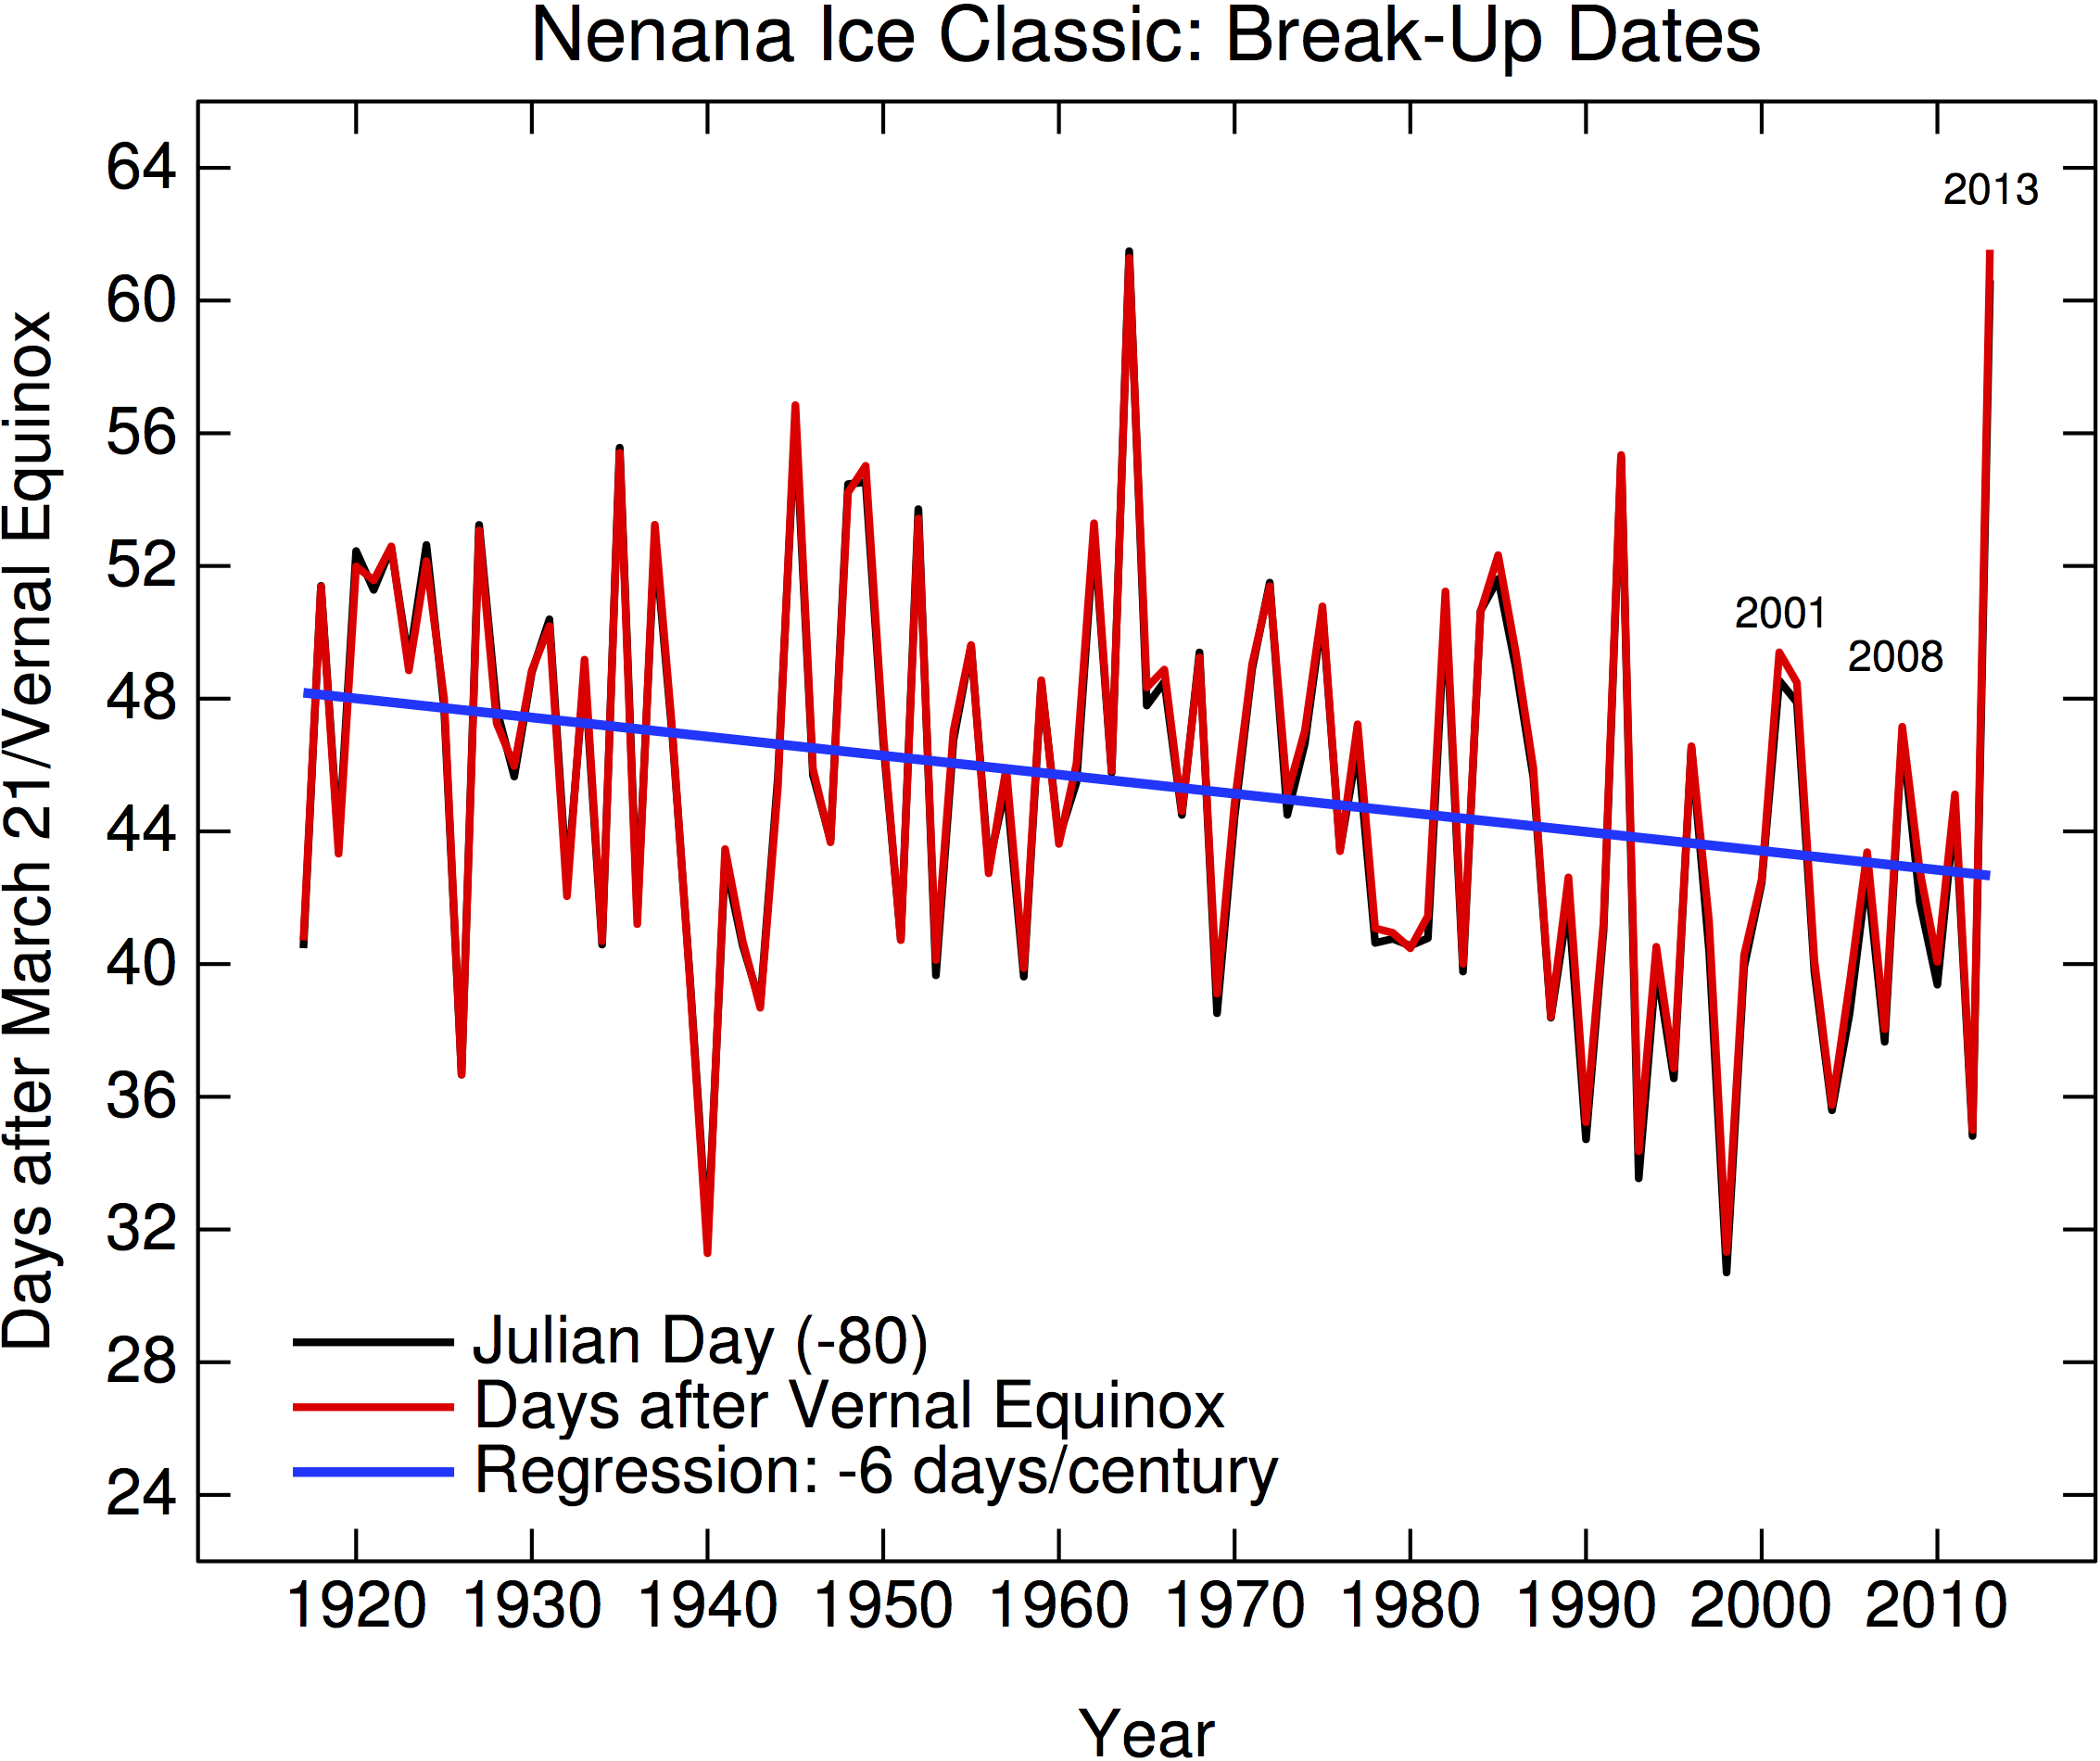
Figure: Break up dates at Nenena in Julian days (either from a nominal March 21 (JD-80), or specifically tied to the Vernal Equinox). Linear trend in the VE-corrected data is ~6 days/century (1917-2013, ±4 days/century, 95{533314f2540bdd33bbc04377fd32ff805adcd56cc20929d47e9b088aa1bb02ce} range).
In the 2008 WSJ article Martin Jeffries, a local geophysicist, said:
The Nenana Ice Classic is a pretty good proxy for climate change in the 20th century.
And indeed it is. The break-up dates are strongly correlated to regional spring temperatures, which have warmed over the century, tracking the Nenana trend. But as with the cool weather January 2014 in parts of the lower 48, or warm weather in Europe or Alaska, the expected very large variability in winter weather can be relied on to produce outliers on a regular basis.
Given that year-to-year variability, it is predictable that whenever the annual result is above trend, it often gets cherry-picked to suggest that climate change is not happening (despite the persistent long-term trend). There are therefore no prizes for guessing which years’ results got a lot of attention from the ‘climate dismissives’*. This is the same phenomenon that happens every winter whenever there is some cold weather or snow somewhere. Indeed, it is so predictable** that it even gets its own xkcd cartoon:
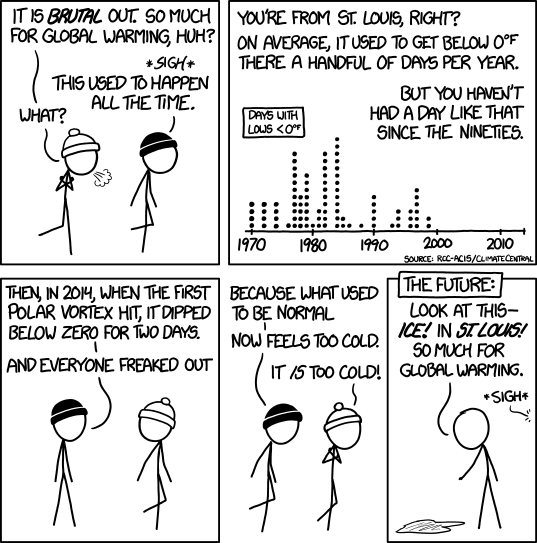
(Climate data sourced from Climate Central).
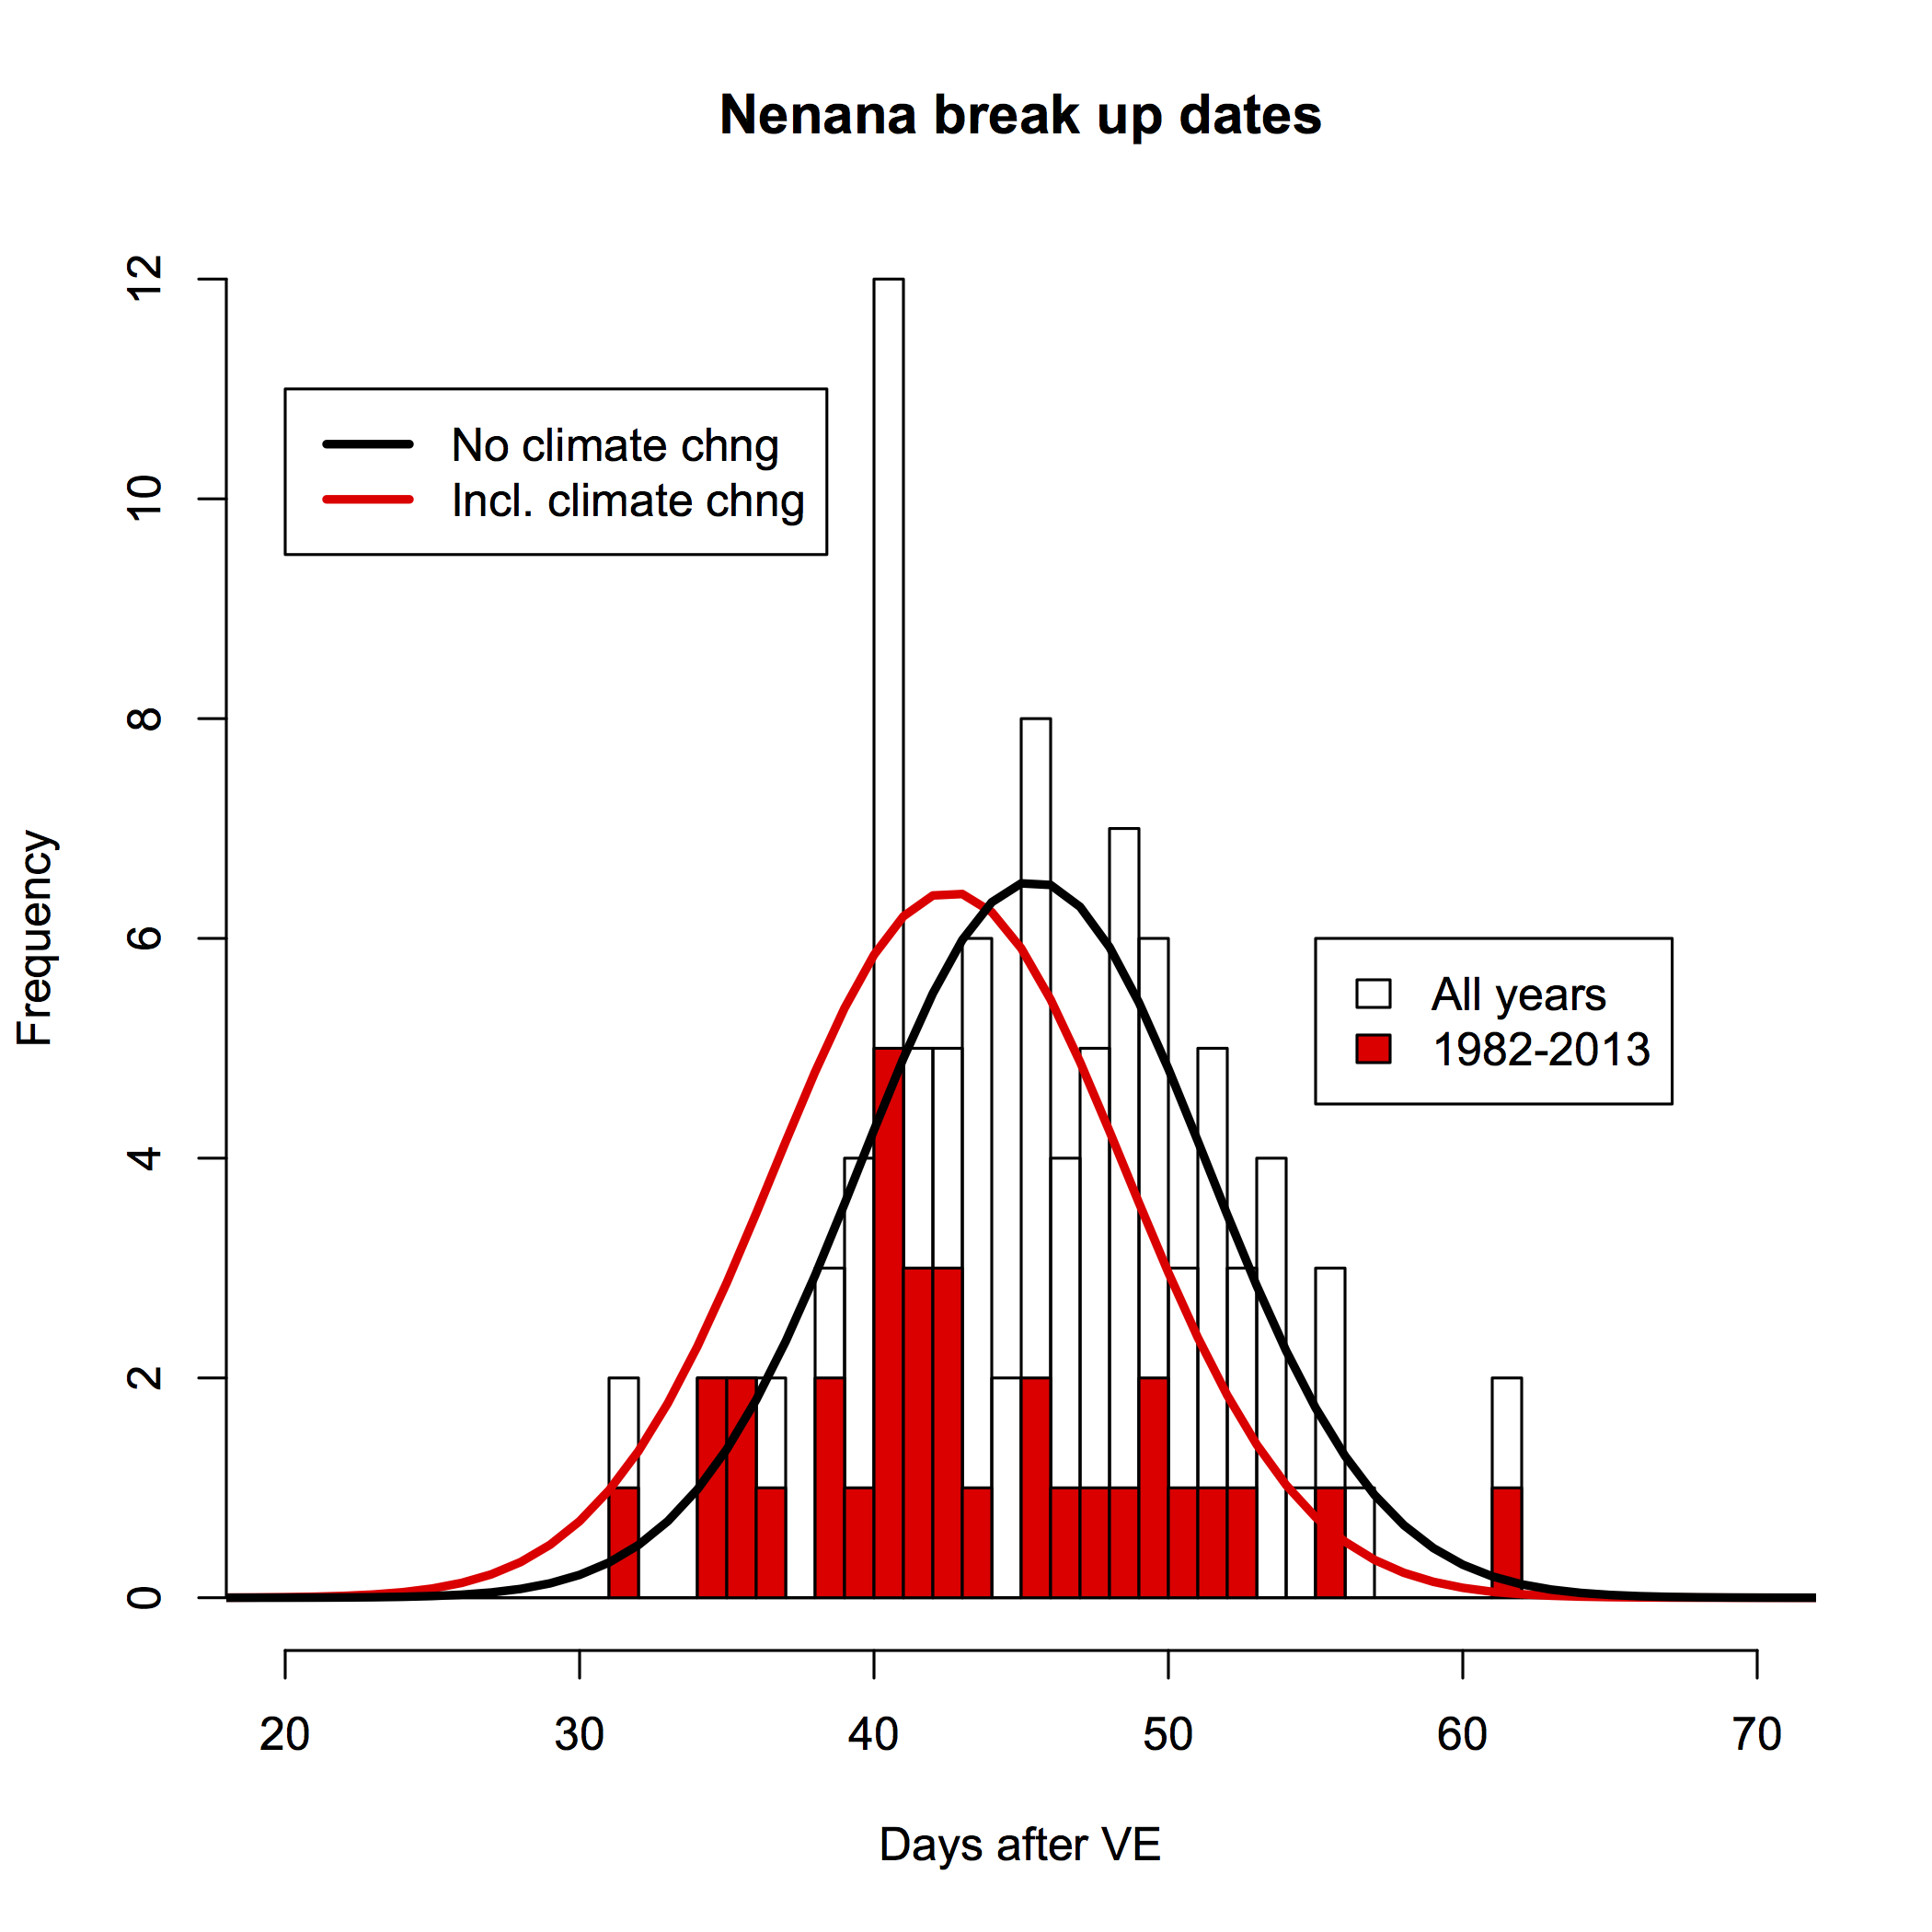 For fun, I calculated some of the odds (Monte-Carlo simulations using observed mean, a distribution of trends based on the linear fit and the standard deviation of the residuals). This suggests that a date as late as May 20 (as in 2013) is very unexpected even without any climate trends (<0.7{533314f2540bdd33bbc04377fd32ff805adcd56cc20929d47e9b088aa1bb02ce}) and even more so with (<0.2{533314f2540bdd33bbc04377fd32ff805adcd56cc20929d47e9b088aa1bb02ce}), but that the odds of a date before April 29 have more than doubled (from 10{533314f2540bdd33bbc04377fd32ff805adcd56cc20929d47e9b088aa1bb02ce} to 22{533314f2540bdd33bbc04377fd32ff805adcd56cc20929d47e9b088aa1bb02ce}) with the trend. The most favored date is May 3rd (with no trend it would have been May 6th), but the odds of the break-up happening in that single 24 hour period are only around 1 in 14.
So, the Nenana ice Classic – unlike the other two examples I mentioned in the opening paragraph – does appear to be a useful climate metric. That isn’t to say that every year is going to follow the long-term trend (clearly it doesn’t), but you’d probably want to factor that in to (ever so slightly) improve your odds of winning.
* Yup. 2001, after 2008, 2011, and 2013.
** It is so predictable, I am thinking about opening a derivative market on whether this year’s Nenana result will get mentioned.
References
R. Sagarin, “Climate Change in Nontraditional Data Sets”, Science, vol. 294, pp. 811-811, 2001. https://dx.doi.org/10.1126/science.1064218
J.A. Francis, and S.J. Vavrus, “Evidence linking Arctic amplification to extreme weather in mid-latitudes”, Geophysical Research Letters, vol. 39, pp. n/a-n/a, 2012. https://dx.doi.org/10.1029/2012GL051000
E.A. Barnes, “Revisiting the evidence linking Arctic Amplification 1 to extreme weather in midlatitudes”, Geophysical Research Letters, pp. n/a-n/a, 2013. https://dx.doi.org/10.1002/grl.50880
(c) RealClimate – Read entire story here.