RealClimate: Spencer’s Shenanigans
4 min read
A recent sensible-sounding piece by Roy Spencer for the Heritage foundation is full of misrepresentations. Let’s play spot the fallacy.
Comparing climate models to observations is usually a great idea, but there are some obvious pitfalls to avoid if you want to be taken seriously. The most obvious one is to neglect the impacts of internal variability – which is not synchronized across the models or with the observations. The second is to avoid cherry picking your comparison – there is always a spread of results by just looking at one small region, in one season, in one metric, so it’s pretty easy to fool yourself (and others!) if you find something that doesn’t match. The third is to ignore what the rest of the community has already done to deal with what may be real issues. Spencer fails to avoid each one of these.
Where’s the model spread, Roy?
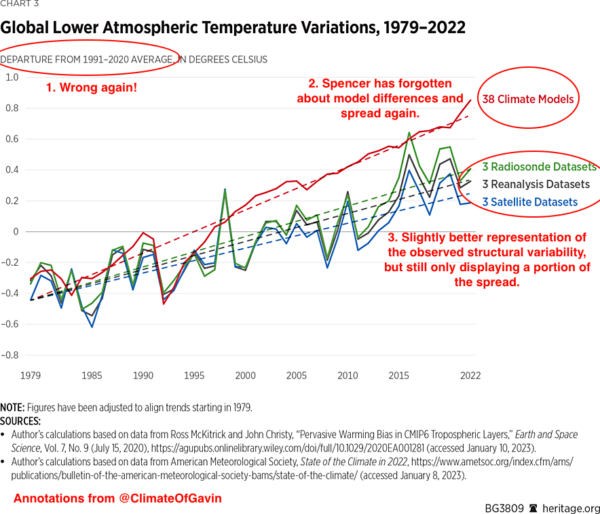
The first figure in Spencer’s article is the following – which I have annotated.
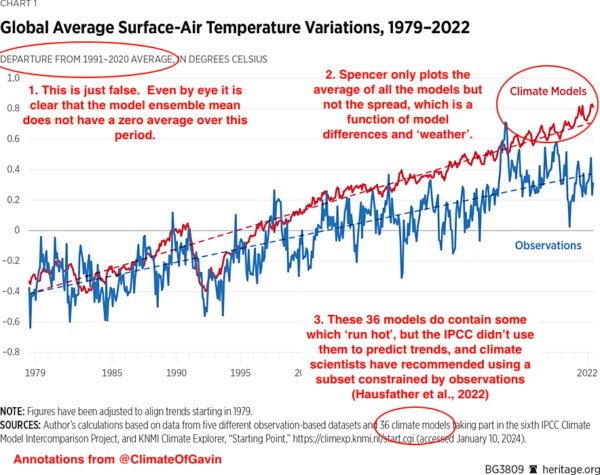
You can see the impact of his choices by comparing to this similar figure from our annual update:
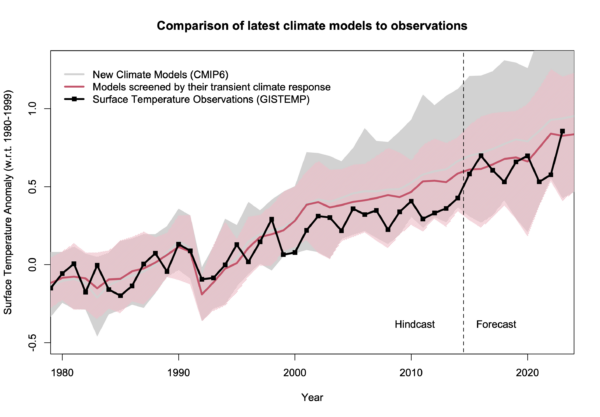
Our figure is using annual mean data rather than monthly (which is less noisy). First, the baseline is what it says on the box – there isn’t an extra adjustment to exaggerate the difference in trends. Second, you can see the spread of the models and see that the observations are well within it. Third, the impact of model selection – that screens the models by their transient climate sensitivity Hausfather et al., 2022 – is also clear (the difference between the pink and grey bands). To be quantitative, the observed trend from 1980 0.20±0.02ºC/dec (95% CI on the OLS trend). The full multi-model mean and spread is 0.26ºC/dec [0.16,0.46], while for the screened subset it’s 0.23ºC/dec [0.16,0.31]. Note that the SAT/SST blend in the observations makes a small difference, as would a different recipe for creating the mean from the individual simulations.
To conclude, the observations lie completely within the spread of the models, and if you screen them based on an independently constrained sensitivity, the fit is very close. Reality 1: Spencer 0.
Cherry-picking season
Spencer’s second figure reflects a more classic fallacy. The cherry pick.
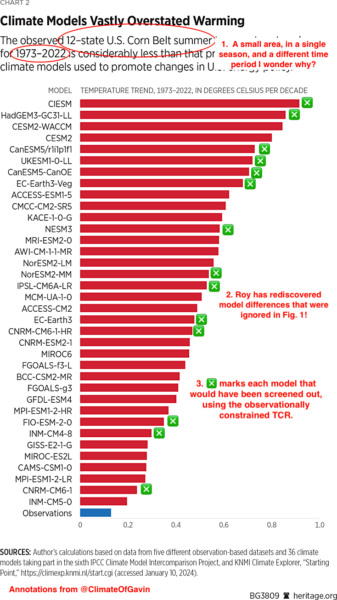
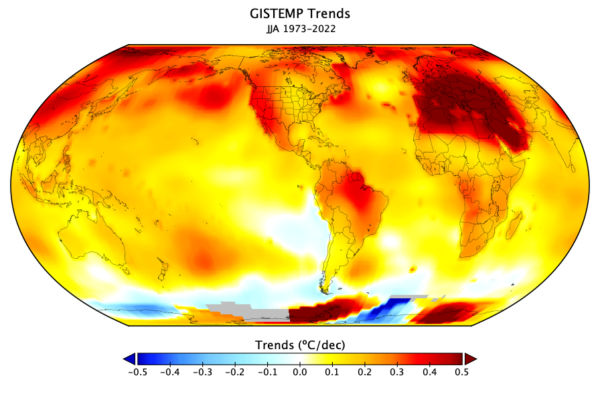
In this comparison, it suits Spencer’s purpose to include individual models, basically because he’s skewed the playing field. Why is this only showing summer data, for 12 US states (I think Iowa, Illinois, Indiana, Michigan, Ohio, Nebraska, Kansas, Minnesota, Missouri, South Dakota, North Dakota, and Wisconsin) and for the odd time period of 1973-2022? What about other seasons and regions? [Curiously, 14 out of the 36 models shown would have been screened out by the approach discussed in our Nature commentary]. We can perhaps gain some insight by plotting the global summer trends from GISTEMP (though it doesn’t really matter which observational data set you use). In that figure, you can see that there is minimum in the warming just to the south and west of the Great Lakes – corresponding pretty exactly to the region Spencer selected. The warming rate there (around 0.12ºC/dec) is close to the minimum trend for northern mid-latitudes and and half of what you would have got for the Pacific North West, or the South West, let alone anywhere in Europe! Therefore it’s the spot most conducive to showing the models overstating warming – anywhere else would not have had the same impact. Reality 2: Spencer 0.
Back to the future
Spencer’s third figure is a variation on an old theme. Again, there is no indication that there is a spread in the models, only limited spread in the observations, and no indication that there is an appropriate selection to be made.
A better comparison would show the model spread, have a less distorting baseline, and show the separate TLT datasets. Something like this perhaps:
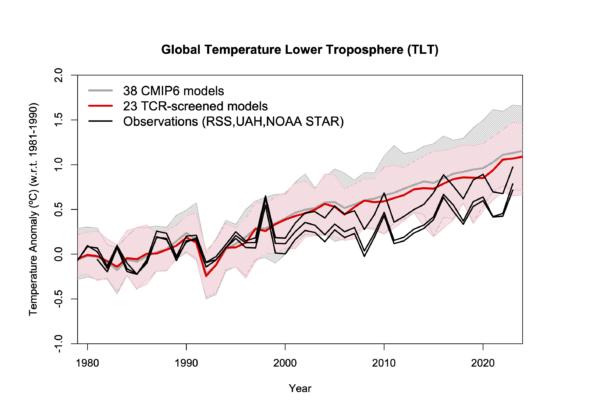
Now, this is the exact same model data that Spencer is using (from McKitrick and Christy (2020) (though the screening uses the TCR from our paper), and updated TLT satellite data. This does show a larger discrepancy than at the surface (and only a minor improvement from the screening) suggesting that there is something a bit different about the TLT metric – but far less than Spencer implies. So, Reality 3: Spencer 0.
Bottom lines
One final point. I don’t criticize Spencer (and Christy before him) because of any tribal or personal animosity, but rather it is because appropriate comparisons between models and observations are the only way to see what we need to work on and where there are remaining problems. The key word is ‘appropriate’ – if that isn’t done we risk overfitting on poorly constrained observations, or looking in the wrong places for where the issues may lie. Readers may recall that we showed that a broader exploration of the structural variations in the models (including better representations of the stratosphere and ozone effects, not included in the McKtrick and Christy selection), can make a big difference to these metrics (Casas et al., 2022).
Spencer’s shenanigans are designed to mislead readers about the likely sources of any discrepancies and to imply that climate modelers are uninterested in such comparisons – and he is wrong on both counts.
References
Z. Hausfather, K. Marvel, G.A. Schmidt, J.W. Nielsen-Gammon, and M. Zelinka, “Climate simulations: recognize the ‘hot model’ problem”, Nature, vol. 605, pp. 26-29, 2022. http://dx.doi.org/10.1038/d41586-022-01192-2
R. McKitrick, and J. Christy, “Pervasive Warming Bias in CMIP6 Tropospheric Layers”, Earth and Space Science, vol. 7, 2020. http://dx.doi.org/10.1029/2020EA001281
M.C. Casas, G.A. Schmidt, R.L. Miller, C. Orbe, K. Tsigaridis, L.S. Nazarenko, S.E. Bauer, and D.T. Shindell, “Understanding Model‐Observation Discrepancies in Satellite Retrievals of Atmospheric Temperature Using GISS ModelE”, Journal of Geophysical Research: Atmospheres, vol. 128, 2022. http://dx.doi.org/10.1029/2022JD037523