RealClimate: Phantastic Job!
5 min read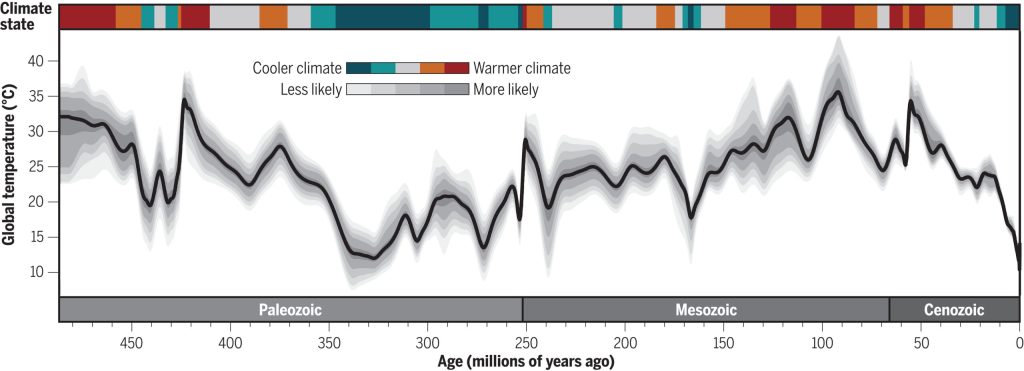
A truly impressive paper was published this week with a new reconstruction of global temperatures over the last ~500 million years.
There is something tremendously satisfying about seeing a project start, and then many years later see the results actually emerge and done better than you could have imagined. Especially one as challenging as accurately tracking half a billion years of Earth’s climate.
Think about what is involved – biological proxies from extinct species, plate tectonic movement, disappearance in subduction zones of vast amounts of ocean sediment, interpolating sparse data in space and time, degradation of samples over such vast amounts of time. All of which adds to the uncertainty.
It is not as though people have not tried – we discussed this here in 2014, where we made a plea for better graphs of the global temperature. Now, 10 years later, we finally have something.
This work was first instigated as part of the pre-development of the Smithsonian’s Deep Time exhibit (which opened in 2019). The curators wanted a credible timeline of temperatures (including glaciations, hot house periods, extinctions, etc.) and, like many of us, had found the then-current literature somewhat unsatisfactory. There was a workshop in 2018 (that I attended) to discuss how one might go about doing something better – updating the data, improving quality control, and using models to better connect local or regional signals to the global means. Interestingly, the resulting PhanTASTIC (“Phanerozoic Time-evolving Averaged Surface Temperature Illustrative Curve”) effort was mostly privately funded. That brought in a postdoc, Emily Judd, who has been working on this ever since! The resulting paper Judd et al., (2024) (direct link) has just appeared in Science.
It’s worth talking about how this reconstruction was made. Prior efforts had been purely data based (with varying levels of corrections for non-climatic effects) and perhaps some effort to estimate global means differently depending on whether the data was from the paleo-tropics or higher latitudes. In this case however, a local temperature anomaly (inferred mostly from carbonate oxygen isotope ratios) was tied to the global mean using a set of climate model simulations for each 5 million year period (run with varying CO2 levels and with the best estimate of the paleogeography). This allowed even data sparse periods to be used to estimate the global mean temperatures (but with greater uncertainty). This kind of data assimilation is effectively a much lower dimensional process than the data assimilation that you might be more familiar with in weather forecasting, but can be quite skillful.
The resulting history back to 480 million years ago has the same broad sweep as has been seen before:
Warm temperatures prior to the Ordovician glaciation, rises of temperature through the Devonian, a dip through the Carboniferous, peaking again at the beginning of the Triassic, slightly cooler in the Jurassic, peaking again mid-Cretaceous and then (roughly speaking) cooling into the Neogene (and the last 3 million years of ice age cycles). However, the relative peaks of the warm and cold periods vary across the reconstructions, as does the scale of changes. Many of the previous reconstructions were however only for the ocean, and one would expect the global mean surface air temperature (as in this effort) to amplify that. For example, the mid-Cretaceous warming (~20ºC warmer than pre-industrial) is notably larger than in prior work.
What’s next?
As in another recent paleo paper, the authors make a partial attempt to estimate what they call an ‘apparent’ Earth System Sensitivity (ESS), this is just based on a regression of the reconstructed temperatures with reconstructed CO2. They get an ESS around 7.7±0.6ºC (95% CI). This isn’t however quite the right calculation (as we discussed in the previous post). The radiative forcing over such a long time period needs to take into account the increase in solar irradiance (about 4%) and the impacts of paleo-geography on temperature that aren’t linked to greenhouse gas changes. The first factor increases the apparent sensitivity, and the second decreases it. Additionally, the ESS is not the same as the ‘standard’ Charney sensitivity (which assumes static ice sheets) and so an ECS estimate would need to take into account the varying levels of land ice over this period and would be smaller. [It might be possible to do a better estimate with just this data… so watch this space].
What could go wrong?
This was a new and ambitious approach to a challenging problem, and there are still a lot of unaccounted for uncertainties. The prior estimate for the temperatures (based on a single, somewhat vintage, climate model) might be biased, the uncertainties in paleo geography might be important, the deep time corrections for diagenetic effects on the oxygen isotopes might be incorrect, etc. One would like to see this explored further in follow-on work – but this may take a while – the 100’s of climate model simulations took years to complete, and would take even longer with a more state of the art model.
This approach was designed for this specific long term reconstruction – not short term variability, but one could envisage an analogous effort more focused on the PETM, or the Permian-Triassic that could give more insight into geologically rapid changes.
Kudos
Nothing is ever the last word in paleoclimate, but this is a tremendous effort that really sets the methodological standard going forward. Well done to Dr. Judd and the rest of the team (and the many folks who’ve been pushing for a better reconstruction along the way).
References
E.J. Judd, J.E. Tierney, D.J. Lunt, I.P. Montañez, B.T. Huber, S.L. Wing, and P.J. Valdes, “A 485-million-year history of Earth’s surface temperature”, Science, vol. 385, 2024. http://dx.doi.org/10.1126/science.adk3705
D.G. van der Meer, C.R. Scotese, B.J. Mills, A. Sluijs, A. van den Berg van Saparoea, and R.M. van de Weg, “Long-term Phanerozoic global mean sea level: Insights from strontium isotope variations and estimates of continental glaciation”, Gondwana Research, vol. 111, pp. 103-121, 2022. http://dx.doi.org/10.1016/j.gr.2022.07.014