Not just another dot on the graph?
5 min read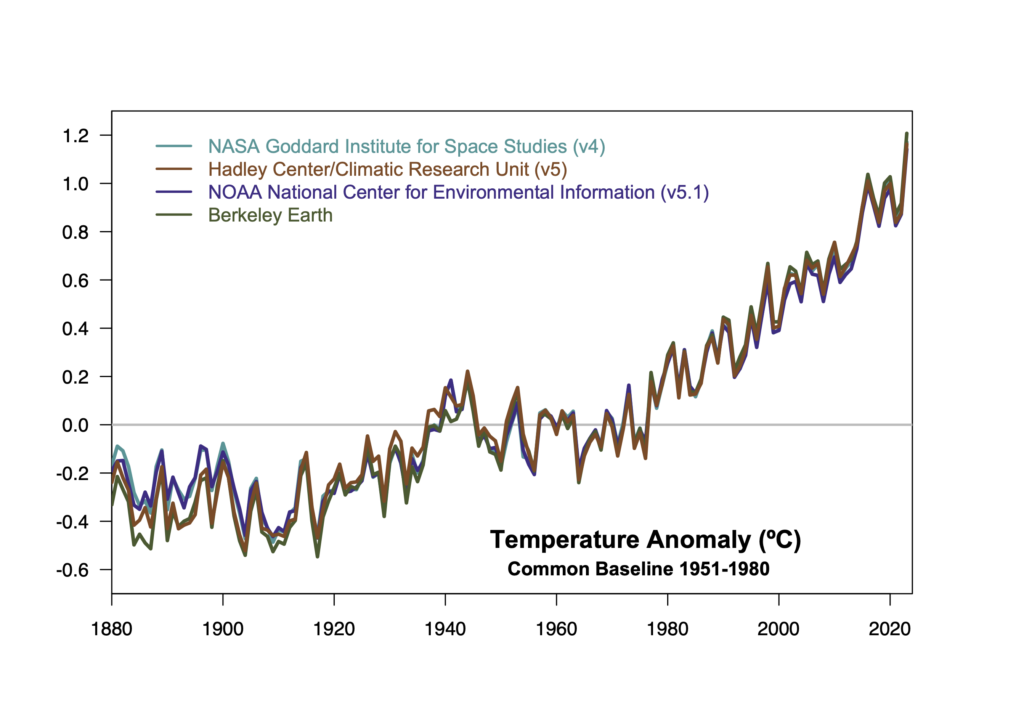
As the climate monitoring groups add an additional dot to their graphs this week, there is some disquiet among people paying attention about just how extraordinary 2023 really was.
First, it’s been obvious for months that 2023 would be a record year – in temperatures (at the surface, troposphere and in the ocean), in Antarctic sea ice, in the number of big climate disasters etc. But this was not at all obvious at the beginning of the year – even assuming that El Niño would develop by the this winter. Indeed, even as late as October, with only two months to go, the estimates for the annual mean still did not encompass the eventual annual number.
In the GISTEMP product, the record was easily broken, and by a record amount. Only the jump from 2014 to 2015 (coincidentally (?) also a year in which El Niño developed over the year) was comparable (both 2023 and 2015 broke the previous record by more than 0.15ºC).

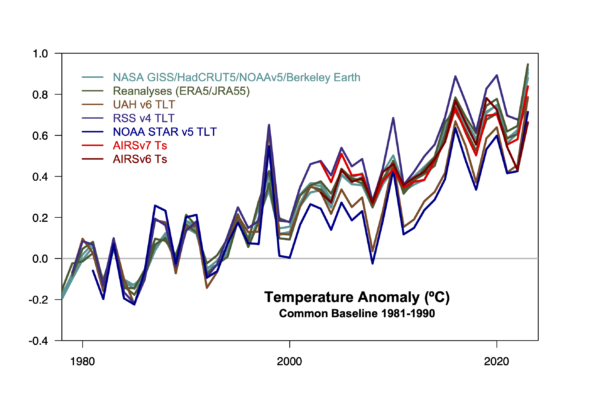
Records were similarly broken in the three MSU/AMSU TLT records (UAH, RSS, and NOAA STAR), and the AIRSv7 data (though not AIRSv6 for some reason), but the structural uncertainty in the satellite derived trends remains.
Why oh why?
So why was 2023 so special? There are lots of candidates, the ongoing El Niño, aerosol decreases, the Hunga-Tonga eruption, internal variability in southern ocean sea ice, extreme Indian-Ocean dipole, the NAO, low levels of Saharan dust, and maybe all of the above. However, none of them on their own are sufficient at least with present estimates. Better quantification is possible (based on updating the sulphate and water vapor data for HT in models, new aerosol emission files, new climate simulations etc.), and the progress of 2024 will hopefully also be informative. But right now, it’s a puzzle.
One swallow does not a summer make, and so I’m still withholding judgement on the degree to which this is a blip or a systematic shift, until we got some more of these factors quantified.
Through a glass, darkly
The comparison figure above neatly illustrates another issue that has come to the fore recently related to questions of exactly what is the warming from the “pre-industrial”? It’s clear that the multiple records post-1970 are all highly coherent (this is something that wasn’t so true 5 years ago, but since everyone now interpolates over the Arctic, the differences have reduced sharply). However, going back before 1940, there is a noticeable increase in the divergence of the records. This is mostly due to the sea surface temperature part of the product – and the two main efforts to define that, HadSST and ERSST from NOAA, adopt quite different methods to fill in missing data in the early part of the record. This leads to a roughly 0.1 to 0.2ºC difference in ‘pre-industrial’ baselines (Berkeley Earth, HadCRUT5 (and hence Copernicus/ERA5) use HadSST and are ~0.15ºC cooler in 1850-1900 than NOAA or NASA (who use ERSSTv5). For reference, 2023 is 1.39, 1.49, 1.37, 1.55ºC warmer than 1880-1900 for GISTEMP, HadCRUT5, NOAA, and Berkeley Earth, respectively, and it is 1.48, 1.34 and 1.54ºC warmer than 1850-1900 for HadCRUT5, NOAA and Berkeley Earth (the difference between the baselines is around 0.01 to 0.03ºC). It’s worth noting that there are some improvements in the uncertainty models for these products are in the pipeline (for instance, Lenssen et al, subm on the new GISTEMP ensemble).
This spread is frustrating to some folks who want (but will not get) a clear answer to the 1.5ºC question, but I would argue that this frustration is largely misplaced. The level of uncertainty that exists (around 0.2ºC) is simply not policy relevant (in the sense that no decisions related to mitigation or adaptation depend crucially on this number). Mitigation of CO2 and CH4 emissions is a worthwhile to reduce future climate risk regardless of whether we are at 1.4 or 1.6ºC above 1850 (the WMO has 1.45±0.12ºC (90% CI)), and adaptation to current and foreseeable future changes is a good idea regardless.
Ongoing issues
Last year at this time, I discussed ongoing work to understand trends in the Southern Ocean. Some of this work was recently published (Schmidt et al., 2023; Roach et al., 2023). The upshot is that the impact of recent anomalous freshwater from the melting of the ice sheet is enough to change the sign of the sea ice and SST trends from 1990 onward, and that the winds are a very good predictor of the interannual variability – and combined, you get a pretty good match to the observations…. until around 2016, when the rapid decline in sea ice extent starts. Efforts to update and improve the freshwater estimates will be undertaken this spring (register for the workshop here!).
As usual, updated graphics can always be found here, and I will undertake to update the model-observation comparisons over the next week or so.
Final amusing anecdote
While of no salience whatsoever, it’s funny to see how the denialists are dealing with all this. Of course, the records being set in the UAH TLT record blows the ‘climate has been cooling since 2016’ trope that they used through to about last summer, leaving them no plausible data refuge. No matter, they then switched to promoting a totally bogus website run by an anonymous coder that purports to give updated global temperature data, but is obviously totally borked. Funnily enough, this ‘data’ also has an upward trend! The subsequent flail is to retreat to “there is no such thing as global mean temperature!” (sure_jan.gif), and that our inability to explain everything about the (non-existent) temperature record is a sign that the ‘science isn’t settled’ (ha!) and therefore we know nothing (surprise!). Some things in climate remain extremely predictable.
References
N. Lenssen, G.A. Schmidt, M. Hendrickson, P. Jacobs, M.J. Menne, and R. Ruedy, “A NASA GISTEMPv4 Observational Uncertainty Ensemble”, 2023. http://dx.doi.org/10.22541/essoar.169875979.91494792/v1
G.A. Schmidt, A. Romanou, L.A. Roach, K.D. Mankoff, Q. Li, C.D. Rye, M. Kelley, J.C. Marshall, and J.J.M. Busecke, “Anomalous Meltwater From Ice Sheets and Ice Shelves Is a Historical Forcing”, Geophysical Research Letters, vol. 50, 2023. http://dx.doi.org/10.1029/2023GL106530
L.A. Roach, K.D. Mankoff, A. Romanou, E. Blanchard‐Wrigglesworth, T.W.N. Haine, and G.A. Schmidt, “Winds and Meltwater Together Lead to Southern Ocean Surface Cooling and Sea Ice Expansion”, Geophysical Research Letters, vol. 50, 2023. http://dx.doi.org/10.1029/2023GL105948