New Google tools to map rooftop solar potential, air quality
3 min read
Google has launched three mapping tools drawing on the tech giant’s artificial intelligence (AI), aerial imagery and environmental data to help businesses and cities accelerate decarbonization efforts.
The tech giant used its at Google Cloud Next ’23 conference to unveil an expansion to the sustainability offering hosted on its Maps platform, including a trio of new tools to designed to provide more up-to-date information on solar power potential, air quality and pollen levels.
The company’s upgraded Solar API will make detailed rooftop data available from more than 320 million buildings to help better estimate solar energy potential and cost and carbon savings.
Using high-resolution 3D models of individual roofs, Google claims the tool will calculate how much sunlight buildings may receive during the day and account for factors such as historical weather patterns in the area and energy costs.
It said the functionality could allow businesses such as solar installers to see how much sunlight buildings receive and calculate potential energy savings before visiting an area or proceeding with an installation.
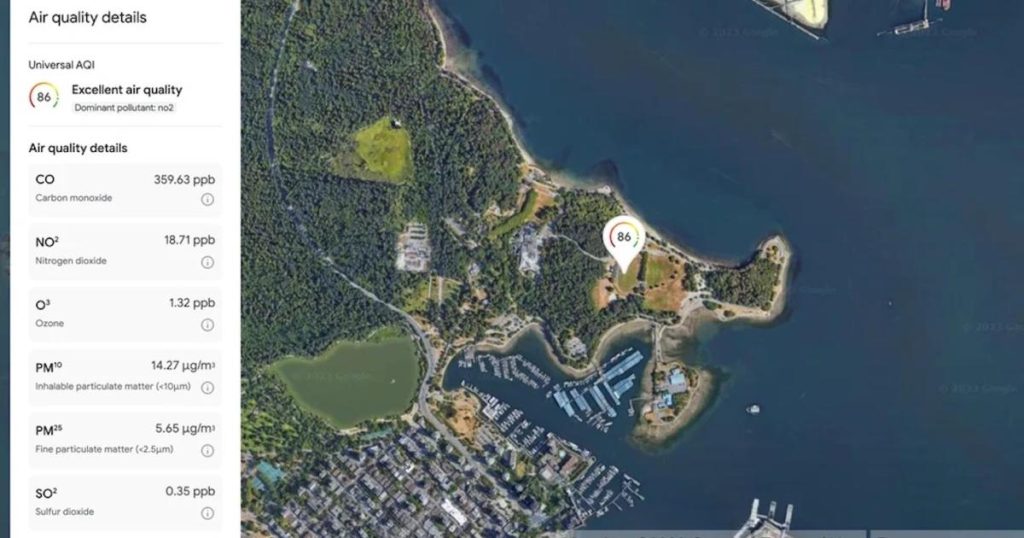
Moreover, the company’s beefed up Air Quality API will offer developers air quality insights for more than 100 countries across Europe, Asia, Africa, Australasia and the Americas, providing a local and universal index, as well as the ability to visualize air pollution via heatmaps.
Building upon Google Maps’ existing air quality layer, the API validates and organizes several terabytes of data each hour from multiple sources — including government monitoring stations, meteorological data, sensors and satellites — to provide a local and universal index.
As such, the app will look at live traffic information to understand congestion data and car volume in an area and using machine learning to predict levels of different pollutants at a given time.
Finally, Google Maps’ Pollen API will provide daily pollen count updates, heatmapping and enable five day forecasts for allergens such as tree, grass and weed pollen, and 15 plant species such as maple, birch and elm.
To get the information, Google will use machine learning to determine where specific pollen-producing plants are located and combine it with data on local wind patterns to calculate the seasonality and daily amount of pollen grains and predict how they will spread.
Yael Maguire, Google’s VP of geo sustainability, said the new tools would help the company realize its ambition to help individuals, cities and partners collectively reduce one gigaton of carbon equivalent emissions annually by 2030.
“With these three new Google Maps Platform APIs, businesses can access comprehensive and up-to-date environmental information to develop sustainability products and help people adapt to the impacts of climate change,” he said.
“We’re dedicated to building tools that organize environmental information and make this data useful for companies, cities and partners so we can all take collective action.”
The update comes a matter of weeks after tests carried out by Google, American Airlines and Breakthrough Energy revealed how pilots could steer clear of routes that create climate-warming contrails by harnessing AI and satellite data to help pilots make flight path decisions that can help reduce aviation’s warming impact.
Moreover, in May Google announced the extension of its Flood Hub platform to scores of additional countries, providing early flood warnings to hundreds of millions of people living in some regions exposed to the highest levels of flood risk.


