Exploring CRUTEM4 with Google Earth
2 min read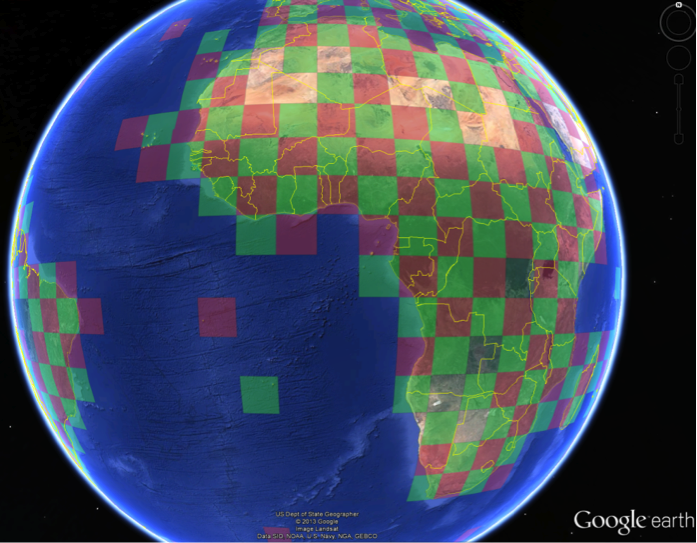
RealClimate –
Guest commentary by Tim Osborn and Phil Jones
The Climatic Research Unit (CRU) land surface air temperature data set, CRUTEM4, can now be explored using Google Earth. Access is via this portal together with instructions for using it (though it is quite intuitive).
We have published a short paper in Earth System Science Data (Osborn and Jones, 2014) to describe this new approach.
This is part of ongoing efforts to make our climate data as accessible and transparent as possible. The CRUTEM4 dataset is already freely available via the CRU and UK Met Office, including the full underlying database of weather station data. But accessing it through Google Earth will enhance:
- Traceability of how we construct the dataset, by showing the weather station data used to make each grid box temperature anomaly.
- Accessibility for teaching and research, by extracting grid box and weather station data without the need for programming.
- Identifying errors. With ~6000 station records collected and collated by third parties there are bound to be errors. If they are identified, they can be corrected. Note that the global temperature record is not greatly affected by changes to the input data (e.g. Figure 5 of Jones et al., 2012).
A walkthrough
The view when the KML file is first opened, with red/green shading to show grid boxes with CRUTEM4 data:
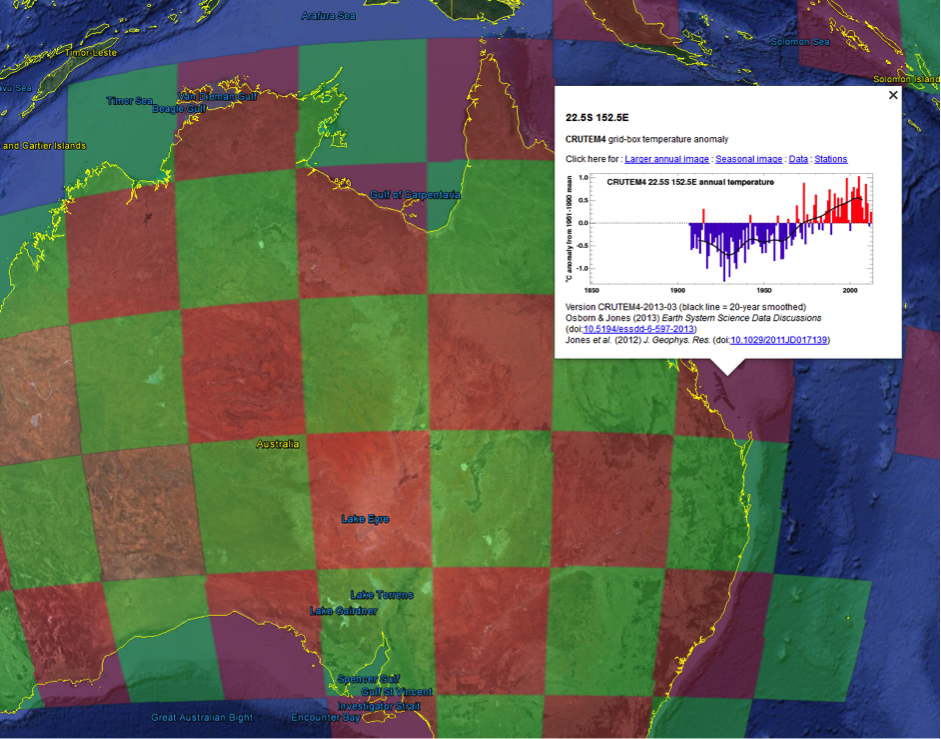
Navigate to a region of interest and click a shaded box to see the grid-box annual temperature anomaly:
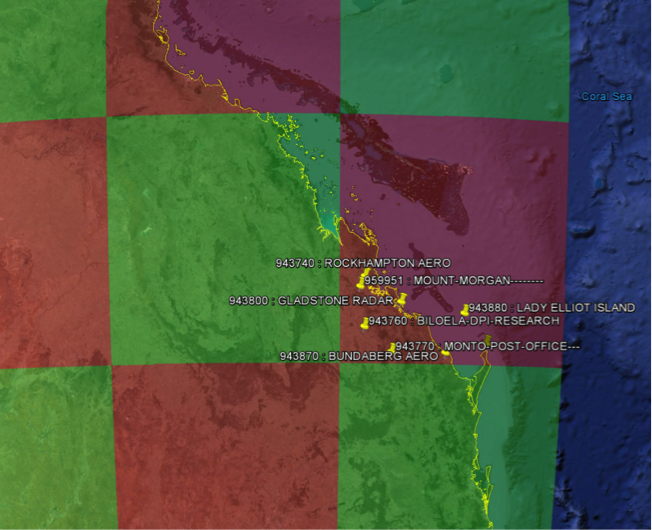
Choose from links to view a larger annual image, a seasonal image, the grid-box data values (in CSV format for import into a spreadsheet) or choose “stations” to see the weather stations used:
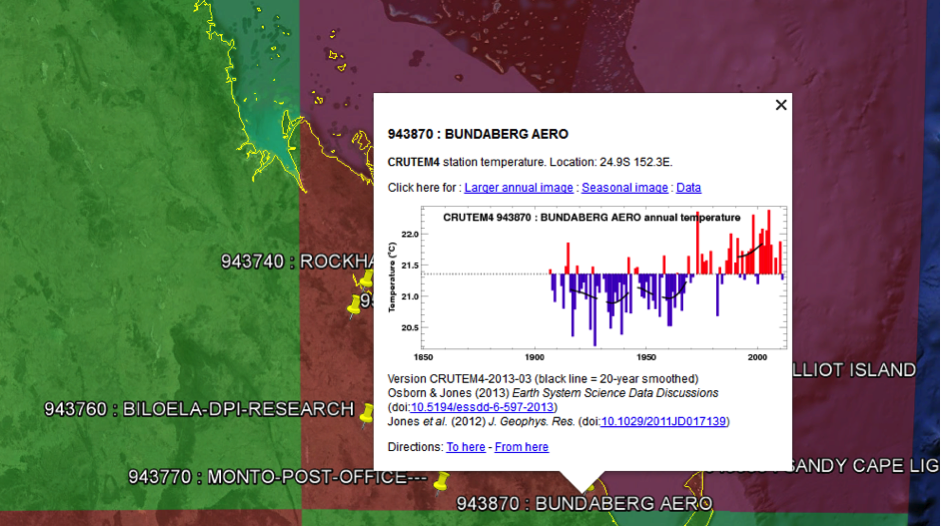
Click a weather station pin to view the station annual temperature series, with links to larger annual and seasonal images, and to the station data values (again in CSV format for easy import into a spreadsheet):
We encourage you to try it for yourself – and to also read the open-access paper (Osborn and Jones, 2014) which describes the construction of CRUTEM4 in detail.
[Editor’s note: Other portals for visualizations of station data exist from David Archer, GISTEMP and many National Weather Service websites.]
References
T.J. Osborn, and P.D. Jones, “The CRUTEM4 land-surface air temperature data set: construction, previous versions and dissemination via Google Earth”, Earth System Science Data, vol. 6, pp. 61-68, 2014. https://dx.doi.org/10.5194/essd-6-61-2014
P.D. Jones, D.H. Lister, T.J. Osborn, C. Harpham, M. Salmon, and C.P. Morice, “Hemispheric and large-scale land-surface air temperature variations: An extensive revision and an update to 2010”, Journal of Geophysical Research, vol. 117, 2012. https://dx.doi.org/10.1029/2011JD017139
(c) RealClimate – Read entire story here.