Not just another dot on the graph? Part II
3 min read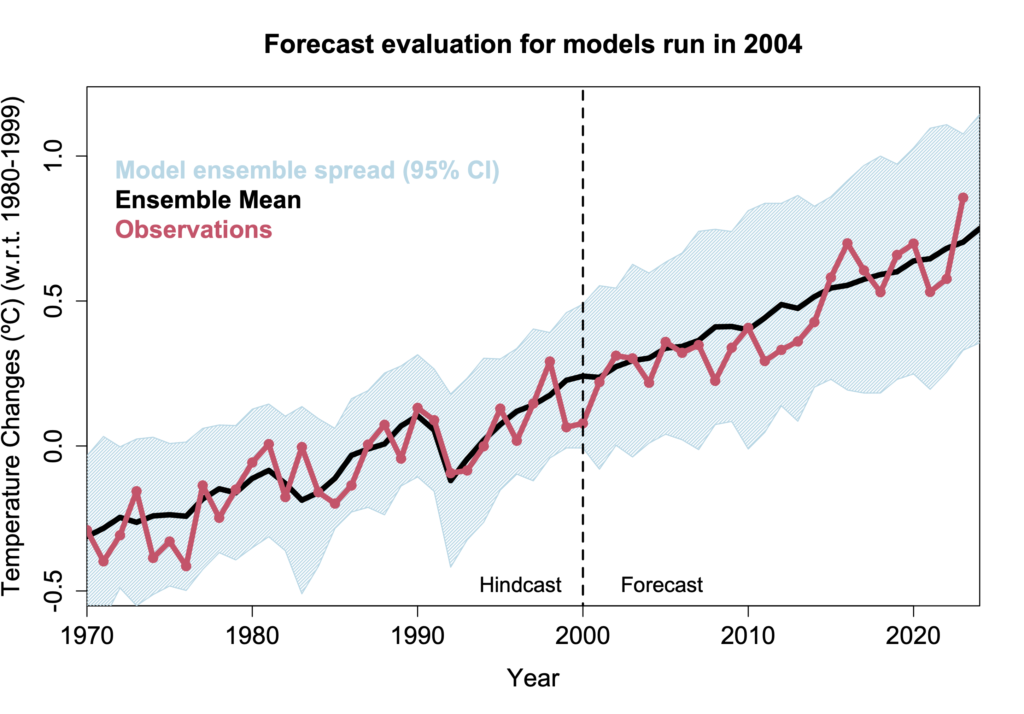
Annual updates to the model-observation comparisons for 2023 are now complete. The comparisons encompass surface air temperatures, mid-troposphere temperatures (global and tropical, and ‘corrected’), sea surface temperatures, and stratospheric temperatures. In almost every case, the addition of the 2023 numbers was in line with the long term expectation from the models.
There were a few minor changes this year: Old versions of the NOAA STAR TMT data are no longer available and so they’ve been removed. All NOAA NCEI surface temperature lines are now using v5.1. New comparisons for SST and TMT-Corrected were added mid-way through last year and have also now been updated.
Highlights
The most impressive comparison continues to be the SAT projections from the CMIP3 models:
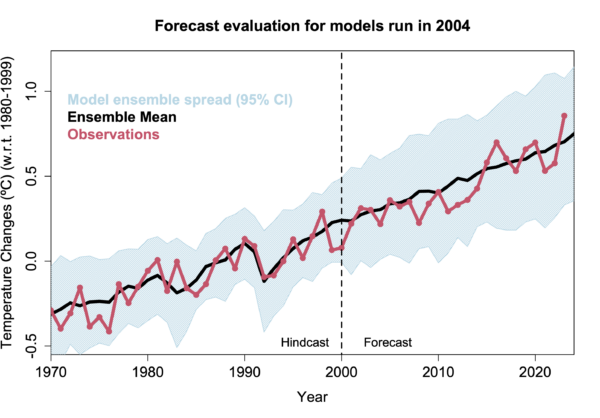
SAT comparisons to the CMIP5 and CMIP6 models are also in line with model expectations. Differences related to the CMIP5 specified forcings are less important than they used to be, and as long as the CMIP6 models are appropriately selected based on the constrained sensitivity, the observations lie close to the mean of the model subset. Compared to the older papers, Hansen et al 1988 for instance, 2023 brings the observations a little closer to Scenario B, which was the closest GHG concentration pathway to what actually occurred.
This success might seem confusing given the ongoing puzzlement about why 2023 was so astonishingly warm compared to recent years. But there is no contradiction because these are referring to slightly different questions. In discussing the observations, we are tracking specific processes and interactions and we would like to be able to use them to explain why any specific year was warmer or cooler than another. However, when we are looking at the climate model ensembles, we are trying to average over all of the individual weather-related phenomena to discern the predictable, forced, response. For each of the ensembles (CMIP3, CMIP5, CMIP6), 2023 was above the mean expectation of the model surface air and sea surface temperatures, but still well within the spread of model results (which exists mainly because of the distinct weather patterns in each simulation). This does influence my expectation as to whether 2023 presages a new, accelarated, phase of global warming, since as far as I can see, 2023 was well within the expected range of temperatures even though the specific reasons in 2023 are still unclear.
Comparisons to the TMT (mid-troposphere temperatures) are slightly improved, but the real world still falls a little below the mean model expectation, regardless of the observational product or corrections. We discussed reasons for this in a paper last year (Casas et al., 2023) and showed that, in the GISS models at least, the spread in TMT trends was large as a function of the structural uncertainty in the models (the quality/strength of a model’s stratospheric circulation for instance), and that it may be that there simply isn’t sufficient structural variation in the standard CMIP ensembles to encompass the observations.
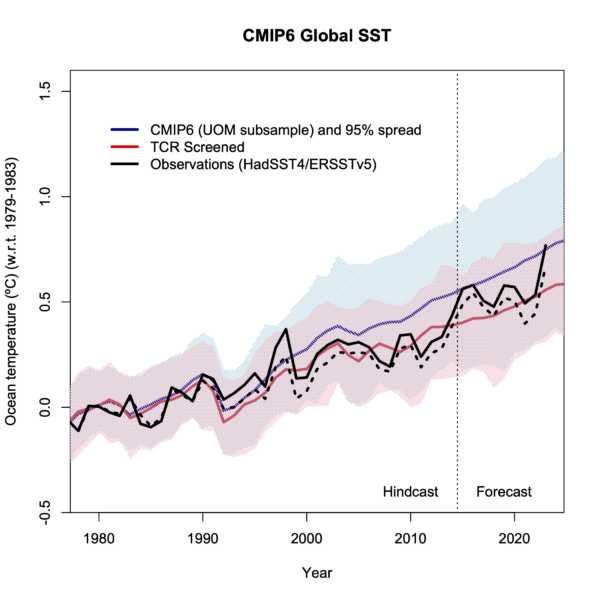
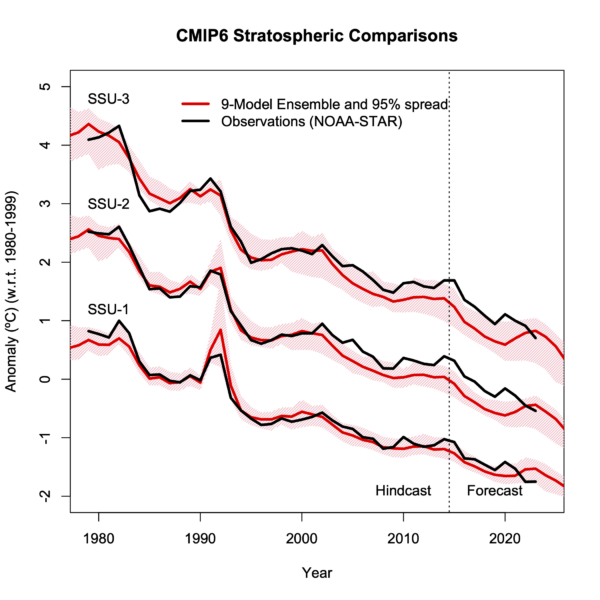
For the other variables, the 2023 SSTs are edging towards the top of the screened CMIP6 ensemble (depending on the product), but the stratospheric temperatures are well within expectations.
Summary
The various model ensembles of opportunity that make up the CMIP effort have collectively been extremely useful at assessing what are the robust predictions of the models, and where there is more uncertainty. Overall, temperatures are well modeled and have proven skillful over time, but there are many secondary issues – like the regional patterns or the abrupt changes in trends that continue to challenge models and make the science interesting.
If you would like to see any new variables included in this annual summary, you need to find an existing collation of model output for specifically that variable – including both hindcasts and projections, and an observational data source that is operationally maintained.
References
M.C. Casas, G.A. Schmidt, R.L. Miller, C. Orbe, K. Tsigaridis, L.S. Nazarenko, S.E. Bauer, and D.T. Shindell, “Understanding Model‐Observation Discrepancies in Satellite Retrievals of Atmospheric Temperature Using GISS ModelE”, Journal of Geophysical Research: Atmospheres, vol. 128, 2022. http://dx.doi.org/10.1029/2022JD037523