RealClimate: As Soon as Possible
9 min read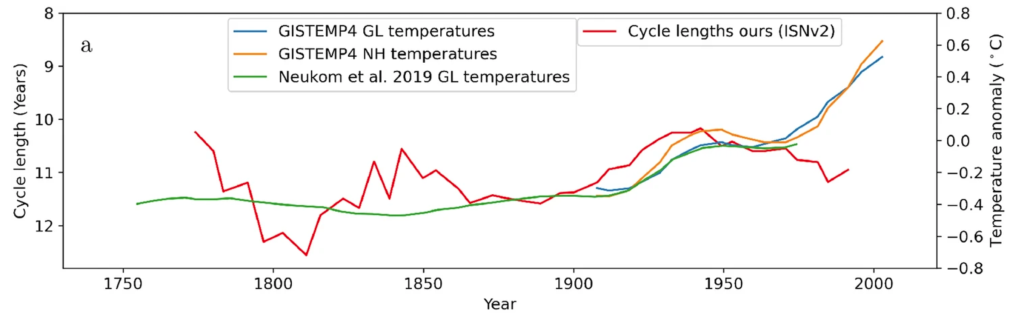
The latest contrarian crowd pleaser from Soon et al (2023) is just the latest repetition of the old “it was the sun wot done it” trope[1] that Willie Soon and his colleagues have been pushing for decades. There is literally nothing new under the sun.
Before diving into the specific artifices in the latest paper, a little trip down history lane might be fun to set the context…
“It’s the Sun”
Solar variability as a potential cause for climate change has a long (and somewhat dubious) history in climate science – going back at least to the poor statistics and over-confident claims of William Herschel (Love,2013). However, the searching for (and finding!) of solar correlations in all manner of climate records (and non-climate records) has been a staple of the ABC (‘Anything-but-CO2‘) crowd since the 1980s.
A particular low-light was the publication in Science [!] by Friis-Christensen and Lassen (1991) of a seemingly impressive correlation between solar cycle length (SCL, the time between successive solar minima or maxima) and global temperatures. This predated the modern social media ecosystem and increasingly open science methodologies and so was perhaps not as scrutinized as a similar paper would be today, but the (still uncorrected!) correlation was marred by an unreported shift in the smoothing method towards the end of the series (Laut and Gundermann, 2000). Purported updates to these series were themselves plagued by arithmetic errors which negated their conclusions (Laut, 2003). More recent reassessments of this hypothesis – using updated sunspot cycle data, updated temperature data and analysis through to the present find no relationship between SCL and the modern rise in temperatures (Chatzistergos, 2023).
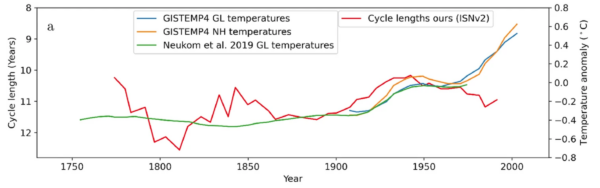
Why is this relevant? Well, back in 1993 (before the more comprehensive critiques had been published), Hoyt and Schatten put together a long-term estimate of solar activity that relied on the SCL, based on the idea from FCL91 and scaled to a finding about cycling and non-cycling stars that turned out to be wrong too (Wright, 2004). But logically, if the SCL is not relevant for temperature or solar activity, reconstructions based on SCL are not going to predictive of temperature either. Worse still, extensions of HS93 to the present using the same flawed predictors, are also not going to be useful.
Perhaps you can see where this is going, but first a quick dive into Arctic temperatures…
The Arctic Lifeboat
By the mid-1990s, it was clear that solar activity (normally defined) was not going to be able to explain the rapid rise in global temperatures since the 1970s (Thompson, 1997. And by the 2007 IPCC AR4 report, or in Lean and Rind (2008)), at best, scientists had concluded that solar activity wasn’t likely to be responsible for more than 10% or so of the long term rise in global temperature.
However, there was a lot more multi-decadal variability in the Arctic and North Atlantic than was present in the global temperature record. Indeed, it was still possible to claim in 2000 that Arctic temperatures had not yet exceeded levels in the late 1930s/early 1940s. Furthermore, if you squinted, you could perhaps convince yourself that there was a correlation to solar activity – well, at least Soon could (Soon, 2005)). And which solar reconstruction did he use? Hoyt and Schatten (1993, updated to 2000) of course! Minor inconveniences (like the Arctic temperatures leading solar activity in the 1930s, or the lack of correlation with other solar reconstructions that were available at that time, such as Lean (1995)) were not discussed.
But still, contrarians could point to Soon’s 2005 figure and claim that it was ‘the sun wot done it’ and elide over the fact that this covered just 5% of global area.
Eppure Si Riscalda
But time marches on, and what might have looked ok in 2005 (using data that only went to 2000) wasn’t looking so great in 2015:
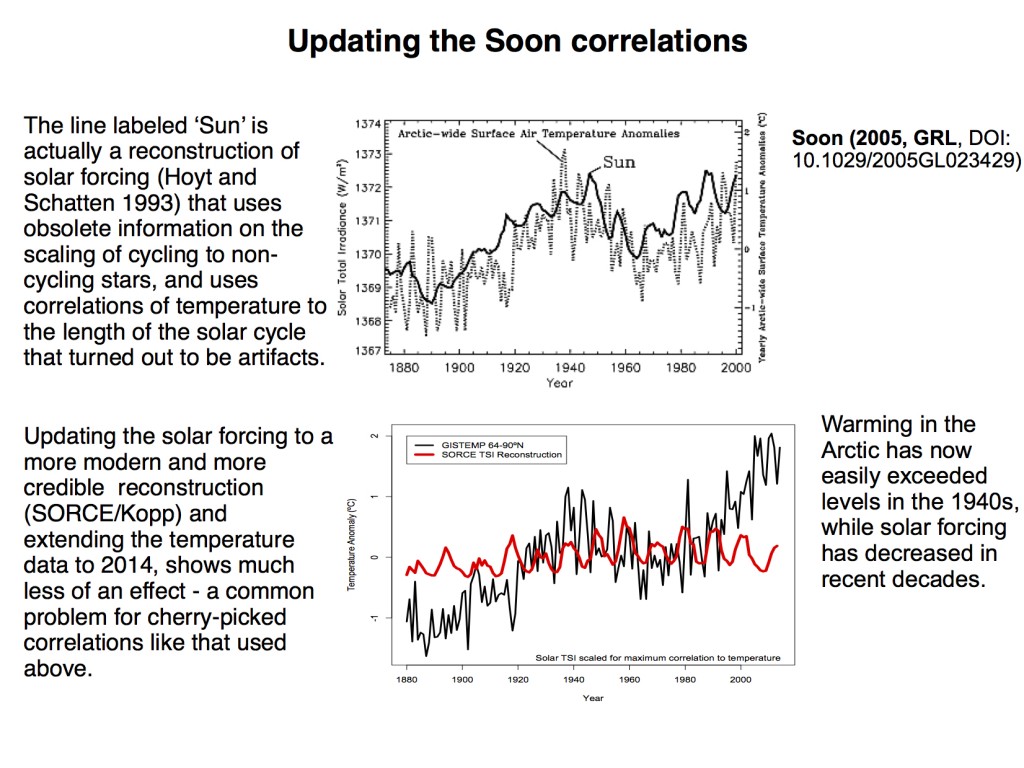
So now there are at least two problems with Soon’s hypothesis: Updated solar reconstructions don’t show as much multi-decadal variability, and none of them match the ongoing increases in temperature, even in the Arctic. Both things would need to be fixed if they want to keep using this trope!
Scafetta to the rescue!
Fortunately, the HS93 reconstruction was extended by our old friend Nicola Scafetta who (partially) used the discredited connection of SCL to global temperature to justify it (Scafetta et al, 2022, even citing the paper with the erroneous arithmetic highlighted by Laut back in 2003. His contribution was to add on the ACRIM composite TSI instead of the PMOD composite TSI post 1980, but this is irrelevant to the longer term variability which Soon found so useful for matching the Arctic temperatures at least to 2000. There’s a bit of a digression in astrology in that paper too, but that’s an issue for another day.
But pay attention here, the solar reconstruction is being justified on the basis of a non-existent correlation to global temperature and also being used to justify a mysterious solar connection to the very different looking Arctic temperatures. How can this circle be squared?
Erin go Bragh!
The Connolly’s do their own research. Based in Ireland one might imagine that they have an particular interest in Irish climate history which is fair enough, but the supposed ‘rural’ NH land temperature record they put together with Soon is something beyond my imagining. Indeed, I have a very hard time understanding why anyone would put together an index consisting of Irish and US rural weather stations, together with Arctic weather stations and a smattering of Chinese stations (Soon et al., 2015;Connolly et al, 2021). It’s not a good areal sample of the northern hemisphere, it’s not a good sample of rural stations – many of which exist in the rest of Europe, Australia, Southern Africa, South America etc., it’s not a good sample of long stations (again many of which exist elsewhere). Rather it seems to simply be an index of opportunity – something that keeps the multidecadal aspects of the Arctic, greatly over emphasizes the rural Irish data (which would otherwise be too areally small to matter much), includes the US rural data because it happens to have an independent database just for CONUS (?), and includes a few (non-rural) stations from China, for no obvious reason at all (AFAICT).
The details of the time series construction are also quite amazing. An areal weighting of the four regional time series might be justifiable, but that isn’t what’s done. An equal weighting of all four regions (yes, seriously) does go into the mix. But so does a series where the regions are weighted by the cosine of the average latitude of the stations (this is mathematically equivalent to assuming each region represents an equal width latitude band centered on the middle of the region, but why?). To be crystal clear, none of this makes any physical sense. However, it does seem to produce less of a warming than the pure Arctic series (which no longer works on it’s own), and retains enough multi-decadal noise to help with the correlation. Mission accomplished!
And also, let’s be clear, this mysteriously justified temperature series has been created explicitly to demonstrate a connection to the HS93 solar reconstruction – that was the case in the Soon et al (2015) paper, the Connolloy et al (2021) paper and now in this new Soon et al paper.
The labeling of this temperature series as a ‘NH rural’ time series is pure marketing – on a par with Erik the Red choosing Greenland as the name of his new colony[2]. If they had really wanted to demonstrate this they could have validated their time series against a suitable target derived from the ERA5 reanalysis, or against totally independent satellite data for the periods of overlap – but of course, they did not.
Reduce, Reuse, Recycle
Soon and his various colleagues have been writing and recycling this same paper for almost two decades (how ecologically friendly!). Each time there is a cherry pick of a region, a series, a blend, that somehow always manages to look similar (and increasingly divorced from any sensibly constructed time series) and mysteriously it always correlates with the same solar activity estimate. And equally predictably the paper is touted as proof that not only are all other temperature series suspect but that the one true series is driven by the sun. How reassuring.
But we have mega-oodles (the SI unit) of additional data that tell us this conclusion cannot be correct. If the sun was driving the warming, we’d see it in the stratospheric temperatures (which are cooling in line with expectations from the impact of CO2, not warming due to the supposed increase in solar activity). If the land data was contaminated by urban heating effects, we wouldn’t see similar warming in the ocean. If the surface temperature data sets were corrupted, why do they line up with the satellite data from the independent AIRS and MSU instruments? Etc.
What we have here is what happens when people are too desperate to hold on to their narrative. A correlation that was bogus when it was proposed three decades ago keeps being reanimated by ever more desperate arithmetical gymnastics and sold as something else entirely. Not only is the actual construction of the Soon et al narrative literally incredible, it contradicts dozens of independent lines of evidence.
It is bunk, and that, it appears, is as Soon as it is possible to be.
[1] This references an infamous UK tabloid headline from 1992.
[2] In the summer Eirik went to live in the land which he had discovered, and which he called Greenland, “Because,” said he, “men will desire much the more to go there if the land has a good name.” The Saga of Erik the Red
References
W. Soon, R. Connolly, M. Connolly, S. Akasofu, S. Baliunas, J. Berglund, A. Bianchini, W.M. Briggs, C.J. Butler, R.G. Cionco, M. Crok, A.G. Elias, V.M. Fedorov, F. Gervais, H. Harde, G.W. Henry, D.V. Hoyt, O. Humlum, D.R. Legates, A.R. Lupo, S. Maruyama, P. Moore, M. Ogurtsov, C. ÓhAiseadha, M.J. Oliveira, S. Park, S. Qiu, G. Quinn, N. Scafetta, J. Solheim, J. Steele, L. Szarka, H.L. Tanaka, M.K. Taylor, F. Vahrenholt, V.M. Velasco Herrera, and W. Zhang, “The Detection and Attribution of Northern Hemisphere Land Surface Warming (1850–2018) in Terms of Human and Natural Factors: Challenges of Inadequate Data”, Climate, vol. 11, pp. 179, 2023. http://dx.doi.org/10.3390/cli11090179
J.J. Love, “On the insignificance of Herschel’s sunspot correlation”, Geophysical Research Letters, vol. 40, pp. 4171-4176, 2013. http://dx.doi.org/10.1002/grl.50846
P. Laut, and J. Gundermann, “Solar cycle lengths and climate: A reference revisited”, Journal of Geophysical Research: Space Physics, vol. 105, pp. 27489-27492, 2000. http://dx.doi.org/10.1029/2000JA900068
P. Laut, “Solar activity and terrestrial climate: an analysis of some purported correlations”, Journal of Atmospheric and Solar-Terrestrial Physics, vol. 65, pp. 801-812, 2003. http://dx.doi.org/10.1016/S1364-6826(03)00041-5
T. Chatzistergos, “Is there a link between the length of the solar cycle and Earth’s temperature?”, Rendiconti Lincei. Scienze Fisiche e Naturali, vol. 34, pp. 11-21, 2022. http://dx.doi.org/10.1007/s12210-022-01127-z
D.V. Hoyt, and K.H. Schatten, “A discussion of plausible solar irradiance variations, 1700-1992”, Journal of Geophysical Research: Space Physics, vol. 98, pp. 18895-18906, 1993. http://dx.doi.org/10.1029/93JA01944
J.T. Wright, “Do We Know of Any Maunder Minimum Stars?”, The Astronomical Journal, vol. 128, pp. 1273-1278, 2004. http://dx.doi.org/10.1086/423221
D.J. Thomson, “Dependence of global temperatures on atmospheric CO
2
and solar irradiance”, Proceedings of the National Academy of Sciences, vol. 94, pp. 8370-8377, 1997. http://dx.doi.org/10.1073/pnas.94.16.8370
J.L. Lean, and D.H. Rind, “How natural and anthropogenic influences alter global and regional surface temperatures: 1889 to 2006”, Geophysical Research Letters, vol. 35, 2008. http://dx.doi.org/10.1029/2008GL034864
W.W. Soon, “Variable solar irradiance as a plausible agent for multidecadal variations in the Arctic-wide surface air temperature record of the past 130 years”, Geophysical Research Letters, vol. 32, 2005. http://dx.doi.org/10.1029/2005GL023429
N. Scafetta, R. Willson, J. Lee, and D. Wu, “Modeling Quiet Solar Luminosity Variability from TSI Satellite Measurements and Proxy Models during 1980–2018”, Remote Sensing, vol. 11, pp. 2569, 2019. http://dx.doi.org/10.3390/rs11212569
W. Soon, R. Connolly, and M. Connolly, “Re-evaluating the role of solar variability on Northern Hemisphere temperature trends since the 19th century”, Earth-Science Reviews, vol. 150, pp. 409-452, 2015. http://dx.doi.org/10.1016/j.earscirev.2015.08.010
R. Connolly, W. Soon, M. Connolly, S. Baliunas, J. Berglund, C.J. Butler, R.G. Cionco, A.G. Elias, V.M. Fedorov, H. Harde, G.W. Henry, D.V. Hoyt, O. Humlum, D.R. Legates, S. Lüning, N. Scafetta, J. Solheim, L. Szarka, H.V. Loon, V.M. Velasco Herrera, R.C. Willson, H. Yan, and W. Zhang, “How much has the Sun influenced Northern Hemisphere temperature trends? An ongoing debate”, Research in Astronomy and Astrophysics, vol. 21, pp. 131, 2021. http://dx.doi.org/10.1088/1674-4527/21/6/131