tipping this century, or not?
6 min read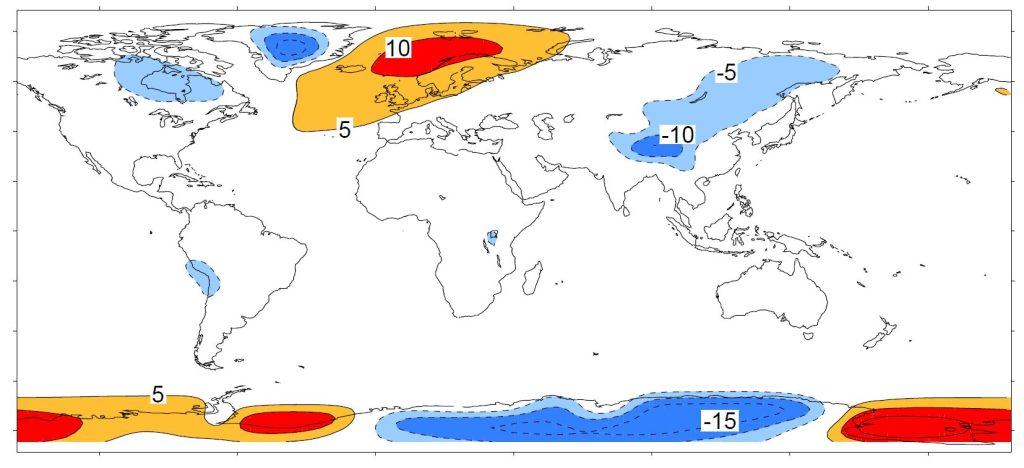
A few weeks ago, a study by Copenhagen University researchers Peter and Susanne Ditlevsen concluded that the Atlantic Meridional Overturning Circulation (AMOC) is likely to pass a tipping point already this century, most probably around mid-century. Given the catastrophic consequences of an AMOC breakdown, the study made quite a few headlines but also met some skepticism. Now that the dust has settled, here some thoughts on the criticisms that have been raised about this study.
I’ve seen two main arguments there.
1. Do the data used really describe changes in AMOC?
We have direct AMOC measurements only since 2004, a time span too short for this type of study. So the Ditlevsens used sea surface temperatures (SST) in a region between the tip of Greenland and Britain as an indicator, based on Caesar et al. 2018 (PDF; I’m a coauthor on that paper). The basic idea starts with the observation that this region is far warmer than what is normal for that latitude, because the AMOC delivers a huge amount of heat into the area. The following chart which I made 25 years ago illustrates this.
If the AMOC weakens, this region will cool. And in fact it is cooling – it’s the only region on Earth which has cooled since preindustrial times. This is commonly referred to as ‘warming hole’ or ‘cold blob’.
We argued in Caesar et al. that the sea surface temperature there in winter is a good index of AMOC strength, based on a high-resolution climate model. (Not in summer when the ocean is covered by a shallow surface mixed layer heated by the sun and highly dependent on weather conditions.) We checked this across other climate models and found that our AMOC index (i.e. based on SST in the ‘cold blob’ region) and the actual AMOC slowdown correlated highly there (correlation coefficient R=0.95).
There are some other indicators, either using measured ocean salinities or using various types of proxy data from sediment cores, e.g. sediment grain sizes at the ocean bottom as indicators of flow speed of the deep southward AMOC branch. The key point to me is: these different indicators provide rather consistent AMOC reconstructions, as we showed in Caesar et al. 2021. The sediment data go back further in time but are likely not as reliable and don’t reach up to the present.
For recent decades there are potentially better approaches like ocean state estimates, and those are also consistent with the SST fingerprint – but these don’t go back far enough in time for the Ditlevsen type of study. The next graph shows a comparison of different reconstructions for the relevant time period used in the Ditlevsen study.
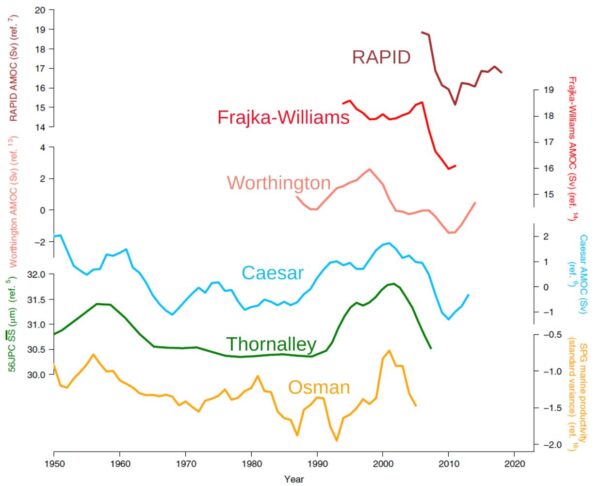
Reconstructions based on salinity may also be good but they depend on precipitation, a notoriously variable quantity so it is rather doubtful whether analysing variance of salinity is doing any better than the SST signal.
The argument has been made that the ‘cold blob’ might not be caused by an AMOC decline but by heat loss at the ocean surface. That’s easy to check: if that were the case, then cooling in the area would be linked to increased heat loss at the surface. But if the AMOC is the culprit, then less heat should be lost, as a cooler ocean surface due to reduced ocean heat transport will lose less heat. The reanalysis data show the latter is the case.
This was shown by Halldór Björnsson of the Icelandic weather service and presented at the Arctic Circle conference 2016. I discussed this here in 2016 and also in my 2018 RealClimate article “If you doubt that the AMOC has weakened, read this”, together with possible other alternative explanations of the ‘cold blob’. We have recently repeated Halldór’s analysis at PIK and got the same results.
My conclusion: for the past century or so the SST data are probably the best AMOC indicator we have, and I don’t see concrete evidence suggesting that it’s unreliable.
2. The Ditlevsen study assumes that the AMOC follows a quadratic curve when approaching the tipping point.
That’s a more technical criticism. Their assumption follows from Stommel’s 1961 simple model of the AMOC tipping point. It results from the basic idea that (a) AMOC changes are proportional to density changes, and (b) the density change results from a balance between freshwater input and AMOC salt transport to the deep water formation (i.e. ‘cold blob’) region. Combined, these two assumptions lead to a quadratic equation.
These are very plausible basic assumptions, albeit using a linear equation of state, but we all know you can linearize things around a given point to get a first-order estimate. The argument that this is “too simple” doesn’t mean it’s wrong; rather this is correct at least to first order.
In a 1996 study I compared the results of a quadratic box model response to a fully-fledged 3D primitive equation ocean circulation model with nonlinear equation of state, the MOM model of the Geophysical Fluid Dynamics Lab in Princeton. It looks like this.
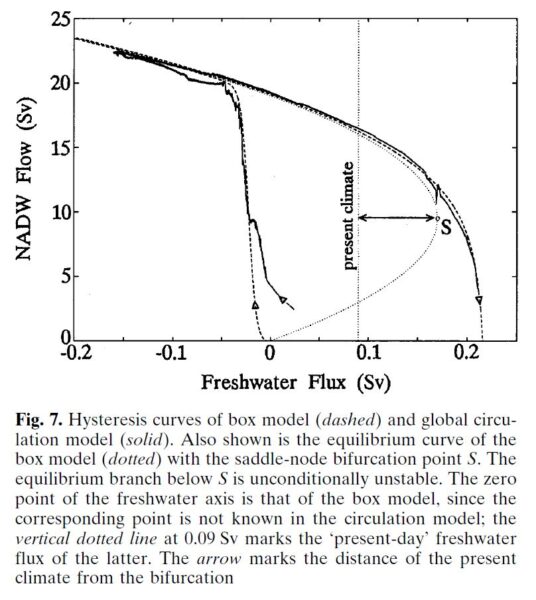
You can’t get a much better fit than that. A similar quadratic shape has also been found by Henk Dijkstra’s group at Utrecht University in a state-of-the-art global climate model, the CESM model (yet to be published). I have not seen any concrete evidence by the critics suggesting the shape may not be quadratic; that seems to be a purely hypothetical possibility. Also, if it is not exactly quadratic, the stated uncertainty range will be larger but it doesn’t fundamentally change the result.
What does it all mean?
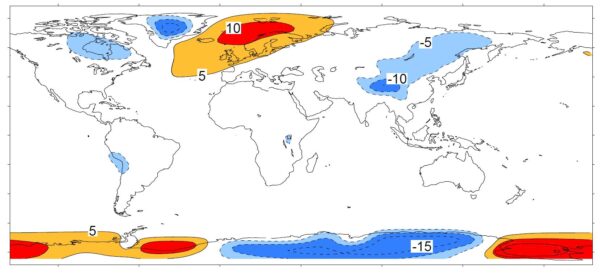
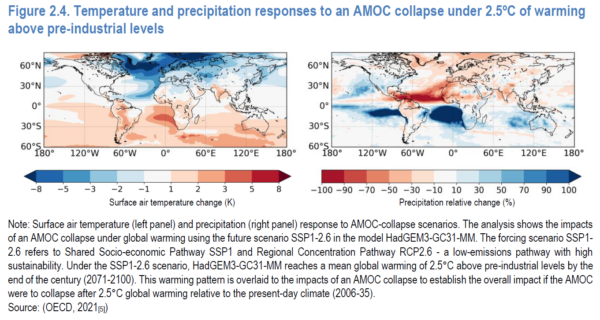
An AMOC collapse would be a massive, planetary-scale disaster. Some of the consequences: Cooling and increased storminess in northwestern Europe, major additional sea level rise especially along the American Atlantic coast, a southward shift of tropical rainfall belts (causing drought in some regions and flooding in others), reduced ocean carbon dioxide uptake, greatly reduced oxygen supply to the deep ocean, likely ecosystem collapse in the northern Atlantic, and others. Check out the OECD report Climate Tipping Points which is well worth reading, and the maps below. You really want to prevent this from happening.
We know from paleoclimatic data that there have been a number of drastic, rapid climate changes with focal point in the North Atlantic due to abrupt AMOC changes, apparently after the AMOC passed a tipping point. They are known as Heinrich events and Dansgaard-Oeschger events, see my review in Nature (pdf).
The point: it is a risk we should keep to an absolute minimum.
In other words: we are talking about risk analysis and disaster prevention. This is not about being 100% sure that the AMOC will pass its tipping point this century; it is that we’d like to be 100% sure that it won’t. Even if there were just (say) a 40% chance that the Ditlevsen study is correct in the tipping point being reached between 2025 and 2095, that’s a major change to the previous IPCC assessment that the risk is less than 10%. Even a <10% chance as of IPCC (for which there is only “medium confidence” that it’s so small) is in my view a massive concern. That concern has increased greatly with the Ditlevsen study – that is the point, and not whether it’s 100% correct and certain.
Would you live in a village below a dammed lake if you’re told there is a one in ten chance that one day the dam will break and much of the village will be washed away? Would you say: “Not to worry, that’s 90 % chance it won’t happen?” Or would you demand action by the authorities to reduce the risk? What if a new study appears, experienced scientists, reputable journal, that says it is nearly certain that the dam will break, the question is only when? Would you demand immediate attention to mitigate this danger, or would you say: “Oh well, some have questioned whether the assumptions of this study are entirely correct. Let’s just assume it is wrong”?
For the AMOC (and other climate tipping points), the only action we can take to minimise the risk is to get out of fossil fuels and stop deforestation as fast as possible. One major assumption of the Ditlevsen study is that global warming continues as in past decades. That is in our hands – or more precisely, that of our governments and powerful corporations. In 2022, the G20 governments alone subsidised fossil fuel use with 1.4 trillion dollars, up by 475% above the previous year. They aren’t trying to end fossil fuels.
Yet, as soon as we reach zero emissions, global warming will stop within years, and the sooner this happens the smaller the risk of passing tipping points. It also minimises lots of other losses, damages and human suffering from “regular” global warming impacts, which are already happening all around us even without passing major climate tipping points.
Links
For more on this, see my long TwiX thread with many images from relevant studies.
What is happening in the Atlantic Ocean to the AMOC?
If you doubt that the AMOC has weakened, read this
AMOC slowdown: Connecting the dots
And for even more, just enter “AMOC” into the search field of this blog!