RealClimate: Area-based global hydro-climatological indicators
4 min read
The World Meteorological Organisation (WMO) Global Climate Observing System (GCOS) and Copernicus Climate Change Services (C3S) both provide sets of global climate statistics to summarise the state of Earth’s climate. They are indeed valuable indicators for the global or regional mean temperature, greenhouse gas concentrations, both ice volume and area, ocean heat, acidification, and the global sea level.
Still, I find it surprising that the set does not include any statistics on the global hydrological cycle, relevant to rainfall patterns and droughts. Two obvious global hydro-climatological indicators are the total mass of water falling on Earth’s surface each day P and the fraction of Earth’s surface area on which it falls Ap.
Global surface area can now be analysed with satellite observations and global reanalyses such as the ERA5 reanalysis. Apparently, Earth’s fractional surface area receiving daily precipitation, Ap, has shrunk over time while the total mass of water falling on Earth’s surface P has increased. Furthermore, our recent analysis suggests that there is a strong correlation between the spatial scales of rainfall patterns and the global mean temperature (Benestad et al, 2022).
A reduction in Ap may in fact provide an additional explanation for both increased (more extreme) precipitation and droughts, in addition to increased evaporation connected with higher surface temperatures. Despite numerous recent headlines on extreme rainfall, flooding and mudslides, there has been little discussion about their causes beyond increased evaporation caused by higher temperatures.
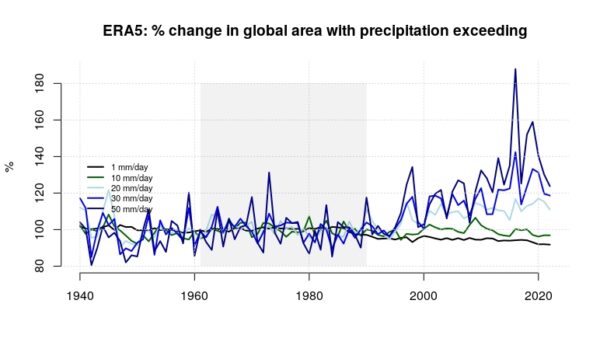
I wonder if the incomplete set of global climate indicators presented by trusted bodies such as the WMO and Copernicus C3S also has an effect on the media and placed a narrow emphasis on temperature. Temperature-based statistics is of course paramount, but other relevant area-based climate indicators also include the fractional area of Earth’s surface that exceeds a threshold, such as 10 mm/day or 50 mm/day of daily precipitation. Such statistics can give a description of how extreme rainfall changes over time.
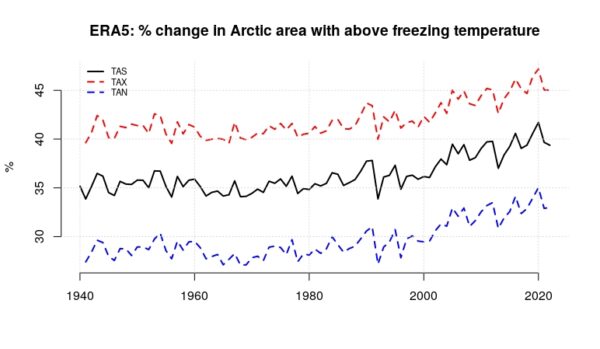
We can extend the set of essential climate statistics to the polar and mountainous regions, and the surface area with daily temperature above freezing can provide a context for the proportion of precipitation that falls as rain or snow. Such an area-based indicator is also relevant for both the snow/ice-cover extent as well as the thawing of permafrost.
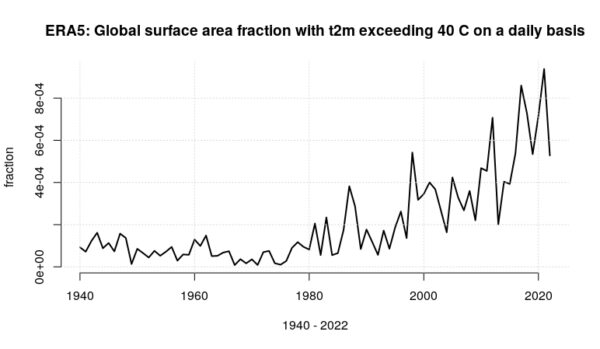
The fraction of the global surface area with maximum temperature above a threshold, such as 40°C, also provides an indication of whether heatwaves are becoming more severe.
Area-based climate indicators are readily computed with the CDO climate data operators applied to netCDF files, and hence can be considered as low-hanging fruits. A sample set is available on a thredds server (easily accessible through the ‘esd’ R-package freely available from GitHub – see sample R code used to make the plots shown here).
It is possible that the Arctic Monitoring and Assessment Programme (AMAP) soon may include the surface area north of 60°N with above-freezing temperature in its upcoming 2023 biennial report. I also think it’s urgent that both the WMO and Copernicus C3S add these global hydro-climatological and area-based indicators to their list of essential climate statistics.
Below are some examples of area-based climate indicators.
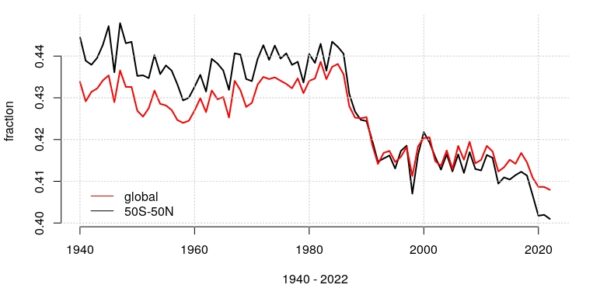
The figure above shows the fraction of global surface area (red) and in the 50°S-50°N latitude band (black) with 24-hr precipitation based on daily ERA5 reanalysis data. The curves present annual mean of daily fractions, and even if the drop during the 1990s may not be quite right, they represent a step towards a better understanding of either the ERA5 data or the real hydrological cycle.
References
R.E. Benestad, C. Lussana, J. Lutz, A. Dobler, O. Landgren, J.E. Haugen, A. Mezghani, B. Casati, and K.M. Parding, “Global hydro-climatological indicators and changes in the global hydrological cycle and rainfall patterns”, PLOS Climate, vol. 1, pp. e0000029, 2022. http://dx.doi.org/10.1371/journal.pclm.0000029